


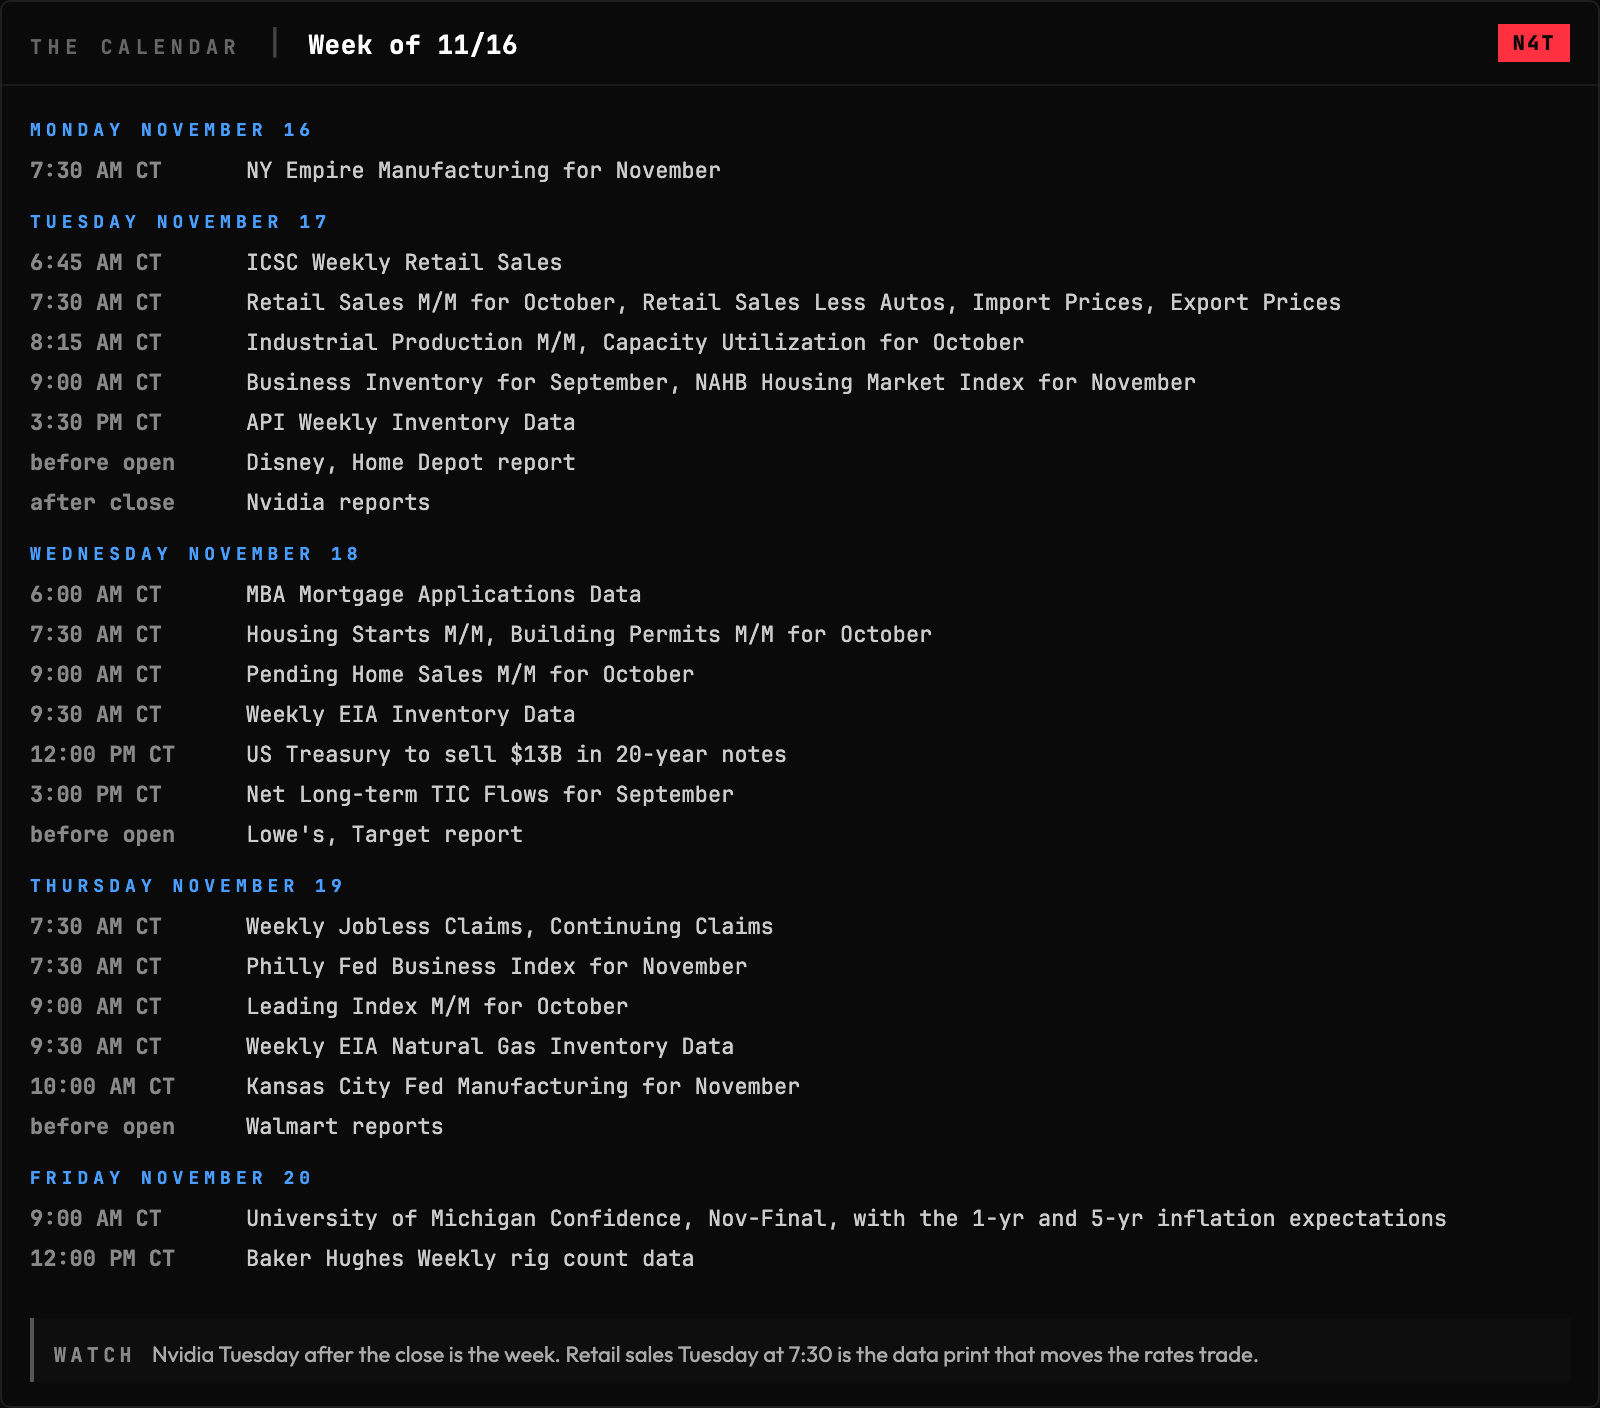
Both stock indexes spent the week climbing back over the price their week did its business at, and both still sit under the price November agreed on. Crude closed the week over the shelf it shares with the month. Gold closed under the one line November left behind it. Nvidia reports Tuesday after the bell and retail sales lands Tuesday morning, and those two prints set the tone for everything after. Should be a good week to trade before we head into Thanksgiving week.
The Week That Was
October CPI ran hot Tuesday and the bond market took Wednesday off for Veterans Day. The Nvidia story landed in two halves, with reports Wednesday night that the board was preparing to move on from Jensen Huang and the company making it official Thursday before the open, handing the job to the CFO on an interim basis. Oil jumped Thursday after the President said the US does not need a deal with Iran, bonds sold off on the oil spike and gold got hit hard. Friday’s PPI came in a bit cooler on the month and stocks still closed lower as the big AI names pulled back. The 10-year ended the week at its highest yield since October and the dollar at a 19-month high, with a December hike priced as very likely. The S&P 500 and Nasdaq still finished the week higher, the S&P’s first winning week since October.
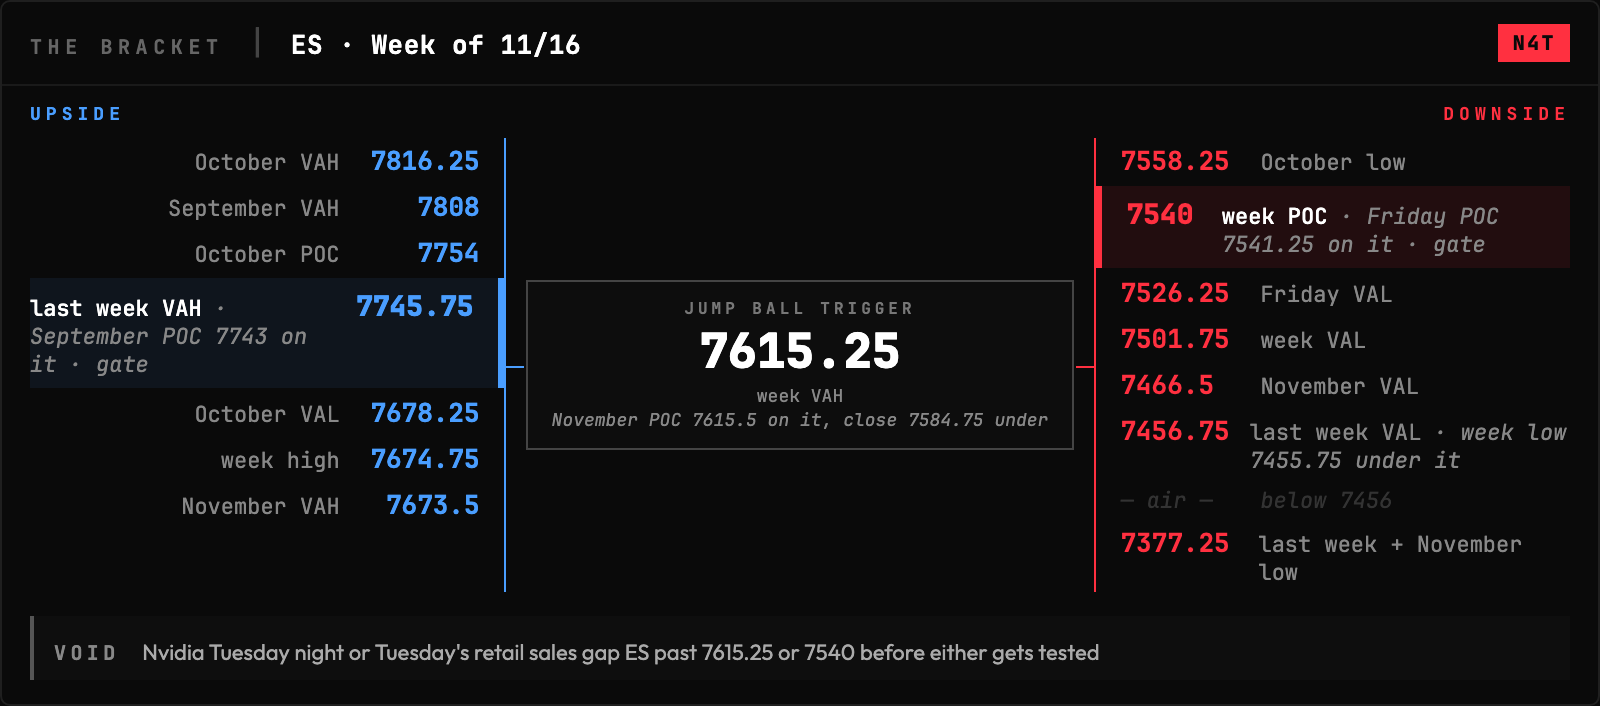
ES is 7584.75 after opening the week at 7465.25, running 7455.75 to 7674.75 and giving a chunk of the top back. The week did its business at 7540 with November’s POC at 7615.5 printed just over the market, and Friday opened at 7642.25, traded down to 7519.25 and closed back over its own 7576 value ceiling. So the bounce put price above Friday’s value but under the week’s 7615.25 ceiling, with two months of volume stacked above that.
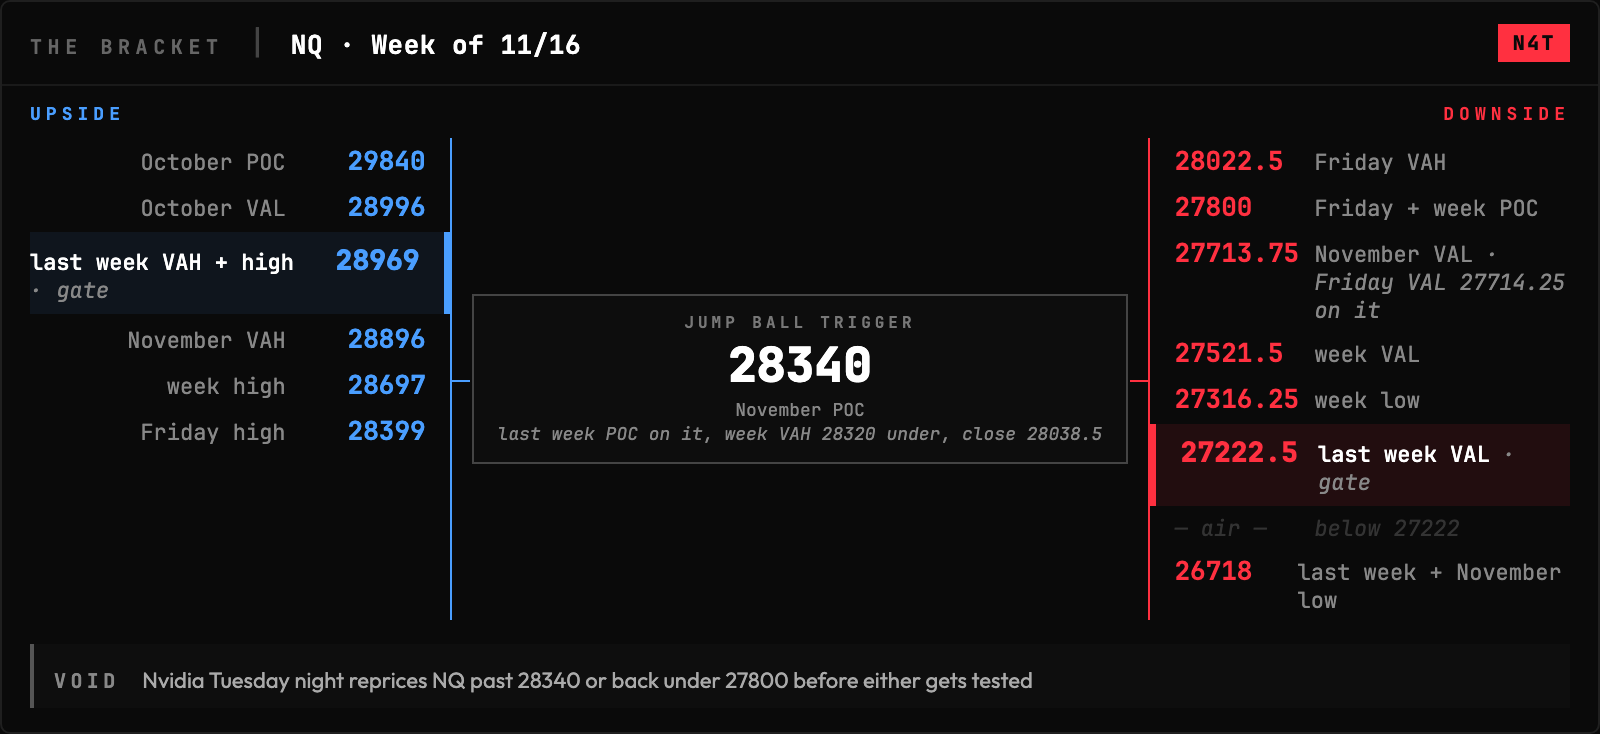
NQ is 28038.5, a hair over Friday’s 28022.5 value ceiling after the week traded 27316.25 to 28697 from a 27342.5 open. Friday and the week both built their heaviest volume at 27800, so the close is back over the price the week actually agreed on, with November’s POC at 28340 still overhead. We’ll see.
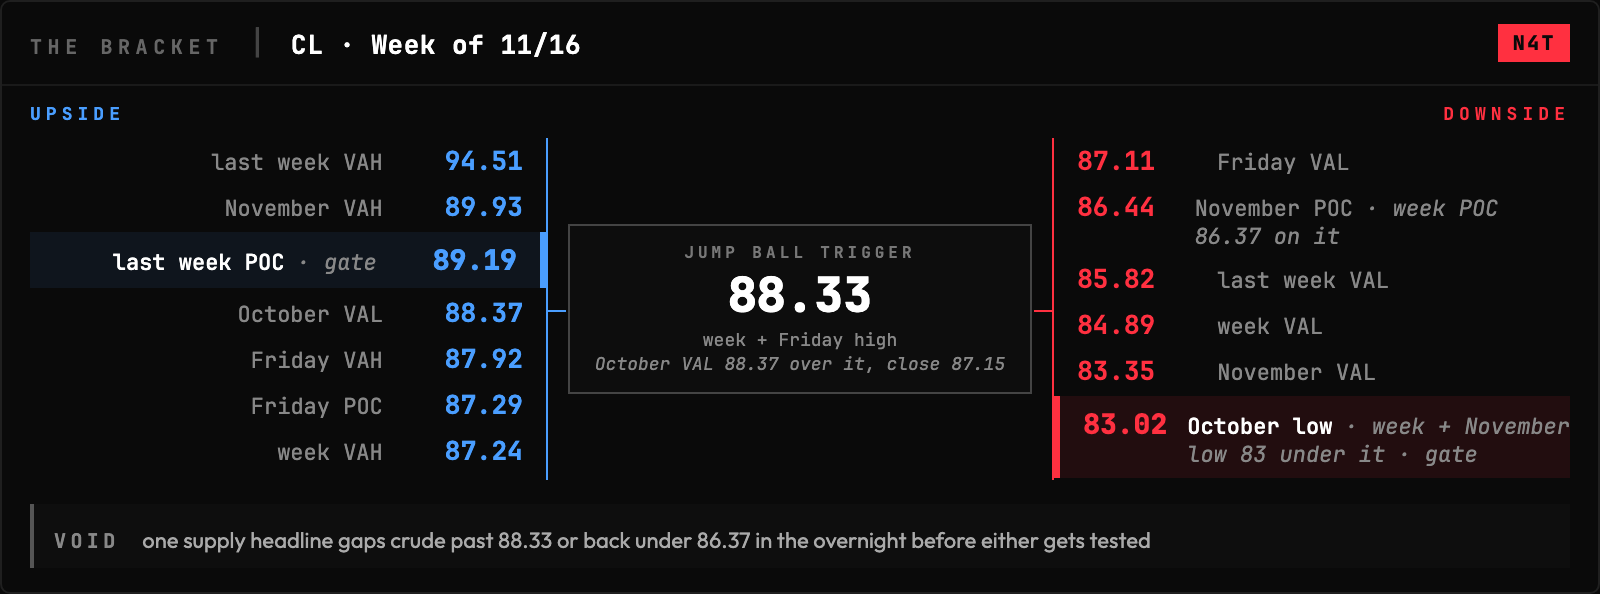
CL closed at 87.15, inside Friday’s 87.11 to 87.92 value, after the week ran 83 to 88.33 from an 85.56 open. The week’s POC sits at 86.37 with November’s 86.44 sharing the shelf, so price closed over the week’s volume but under 89.19 where last week traded most. October’s 88.37 VAL is the first print over the week’s high.
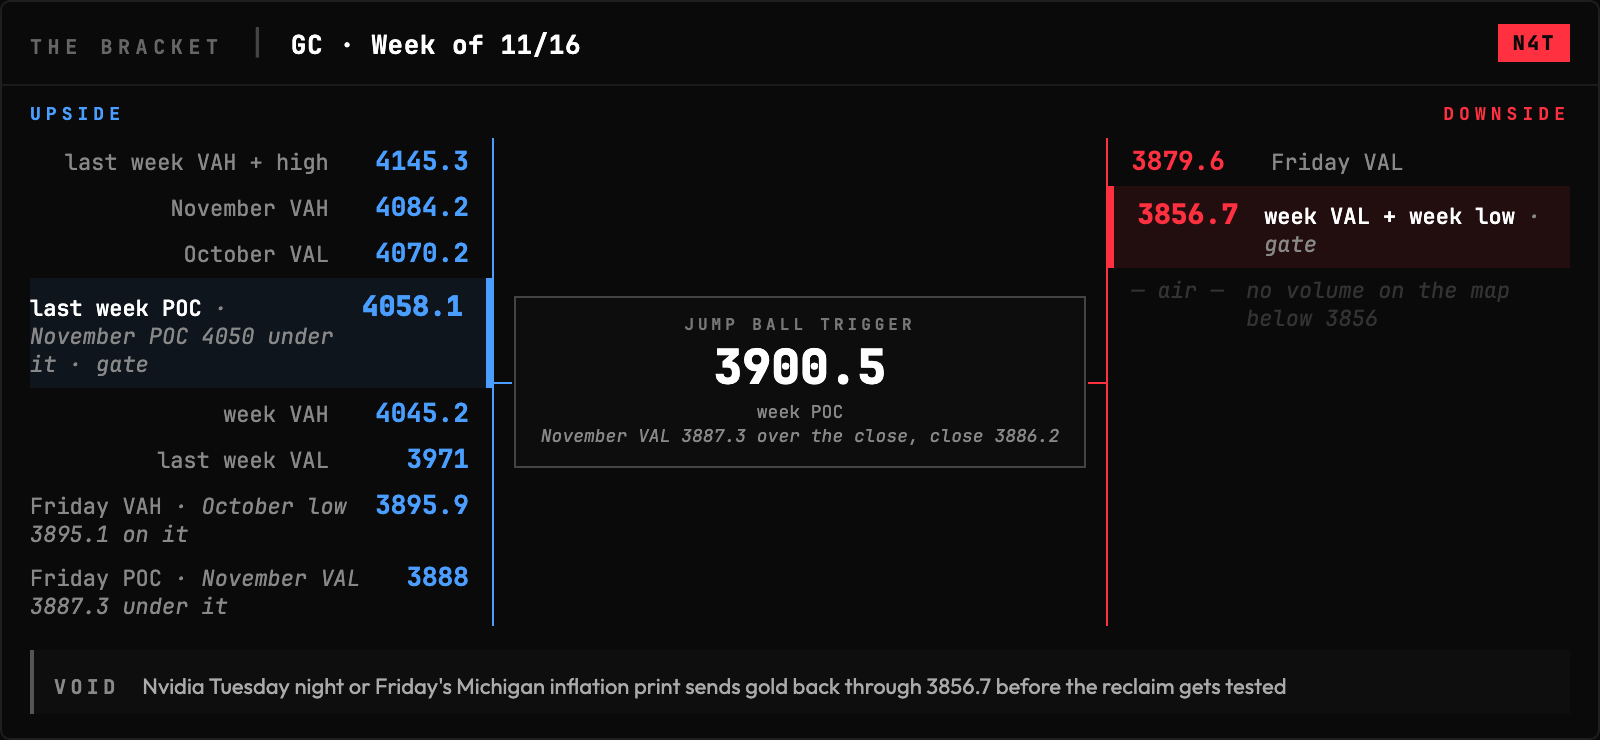
GC is 3886.2, inside Friday’s 3879.6 to 3895.9 value, after opening the week at 4137.6 and sliding to 3856.7. The week’s POC sits at 3900.5 and November’s value floor printed 3887.3, just over the close, so gold ended under the one line the month left behind. Every value area from last week and October is stacked far overhead.
Cross-asset read: Both indexes closed back over their week POCs but under November’s, crude closed over the week and month shelf it shares, and gold closed under its month’s floor. Three charts reclaimed their week’s volume and the fourth is still getting sold into it. Crude and gold both finished nowhere near where their weeks opened, in opposite directions.
Positioning (November 3 data): The S&P crowd added 29,833 longs and 15,996 shorts and sat net short 86,828 as of that report, a book leaning against the market. The Nasdaq crowd barely touched anything, adding 3,436 longs and 4,535 shorts around a net long 46,026.
Vol: VIX went from 25.64 the Friday before last down to Wednesday’s 17.49, the low close of the stretch, then backed up to 18.70 and 19.30 Thursday and Friday. Fear came out of the market midweek and some of it came back Thursday and Friday.
The Calendar
What I’m Watching This Week
1. Nvidia Tuesday night. First report since the CEO change. Whatever the guide says lands on a chart sitting 28038.5, under its month POC with the week’s volume freshly reclaimed underneath.
2. Retail sales Tuesday 7:30 CT. With import and export prices stacked at the same time. This is the print that either confirms the rates crowd or makes them sweat.
3. ES 7615.25. The week’s VAH with November’s POC printed on it. A bounce that takes that shelf has a map to the 7673 to 7678 stack. One that doesn’t is a bounce inside a week the sellers still own the top of.
4. NQ 28340. November’s POC with last week’s printed on the same number and the week’s 28320 VAH right under it. One shelf from 28320 to 28340 decides whether the bounce gets a second leg or Friday’s 28022.5 ceiling was the whole show.
5. Crude 88.33 and gold 3900.5. Crude’s week and Friday high with October’s 88.37 VAL on the far side, over an 87.15 close. Gold’s week POC over a close that couldn’t hold November’s 3887.3 floor.
The Week’s Plan
ES:
ES is 7584.75, back over Friday’s 7576 value ceiling but under 7615.25 where the week’s value tops and November’s POC prints one tick over. That cluster is the trigger, because a bounce that can’t take the week’s ceiling hasn’t actually taken anything back. Take 7615.25 and the work is 7673.5 November’s VAH and 7674.75 the week high, with October’s 7678.25 VAL printed right on top of them. Through that stack, 7745.75 last week’s VAH, 7743 September’s POC and 7754 October’s POC make one shelf, and over it 7808 and 7816.25 are September’s and October’s value ceilings. The counterargument is Friday itself, which opened at 7642.25 near the high and sold to 7519.25. Lose 7540, the week’s POC with Friday’s 7541.25 on it, and 7526.25 Friday’s VAL catches, then 7501.75 the week’s VAL. Under that it’s 7466.5 November’s VAL, then 7456.75 last week’s VAL with the week’s 7455.75 low sitting right there, and air to 7377.25 where last week and November both bottomed.
NQ:
NQ is 28038.5, a hair over Friday’s 28022.5 value ceiling and over 27800 where Friday and the week both did their heaviest business. The gate is 28340, November’s POC with last week’s printed on the same number, and the week’s 28320 VAH sits right under it, so one shelf decides whether this bounce has a second leg. Take it and 28399 Friday’s high is next, then 28697 the week high, with 28896 November’s VAH and 28969 last week’s VAH and high stacked above. Through 28969, October’s 28996 VAL is next, with September’s 29053 low and value floor sharing a print over it, then 29840 where October’s volume lives. What argues for the sellers is where the month came from, 28969 down to 26718, and the week only clawed back part of the trip. A bounce back into a month’s abandoned volume is a bounce until it holds. Lose 27800 and 27713.75 November’s VAL with Friday’s 27714.25 on it catches, then 27521.5 the week’s VAL and 27316.25 the week low. Under that, 27222.5, the bottom of last week’s value, is the gate, and past it 26718 is where November and last week both bottomed.
CL:
Crude is 87.15, at the bottom of Friday’s 87.11 to 87.92 value, just over its 87.11 floor and under the week’s 87.24 value ceiling, with the 87.29 POC over it and the week’s 86.37 POC with November’s 86.44 on the same shelf underneath. The trigger over it is 88.33, the week and Friday high, with October’s 88.37 VAL printed on the far side, so one shelf from 88.33 to 88.37 is where this chart decides. A week high that dies right at an older month’s value floor is the market telling you who owns the line. Take it and 89.19 last week’s POC is next, then 89.93 November’s VAH, and over that 94.51 is where last week’s value topped. What argues against chasing is the close itself, sitting at the floor of Friday’s value after a week that ran the whole 83 to 88.33 range. Lose 87.11 Friday’s VAL and the 86.44 to 86.37 pair catches, then 85.82 last week’s VAL and 84.89 the week’s VAL. Under that, 83 is the week’s low with November’s 83.35 VAL sitting just over it and October’s 83.02 low on the same floor.
GC:
Gold is 3886.2, inside Friday’s 3879.6 to 3895.9 value with the 3888 POC over it and November’s 3887.3 VAL printed just over the close. The trigger is 3900.5, the week’s POC, and a close over it is gold taking back the price it did its business at. Take it and 3971 last week’s VAL is next, then 4045.2 the week’s VAH with November’s 4050 POC right behind it. Over that, 4058.1 last week’s POC, 4070.2 October’s VAL and 4084.2 November’s VAH stack into 4145.3 where last week topped. What argues for the sellers is 3856.7, where the week’s value floor and its low share a print, and the close sits under November’s value floor and under everything last week and October built. Lose 3879.6 Friday’s VAL and 3856.7 is the gate, with nothing on this map under it.
The White Van Stuff
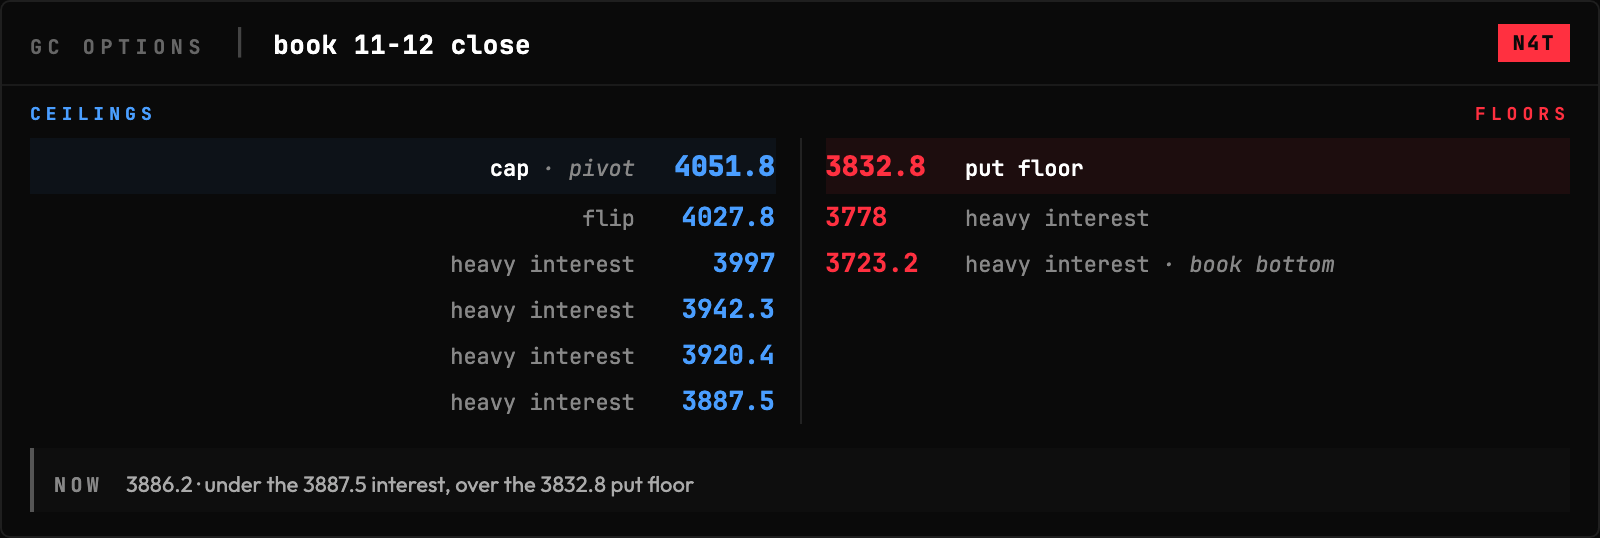
Both index books draw their caps and pivots well over where the week finished, with the floors parked under it. Crude’s book agrees with the profile that the high 80s is the decision shelf, and gold’s pivot and cap sit together way over a close that just lost its month floor.
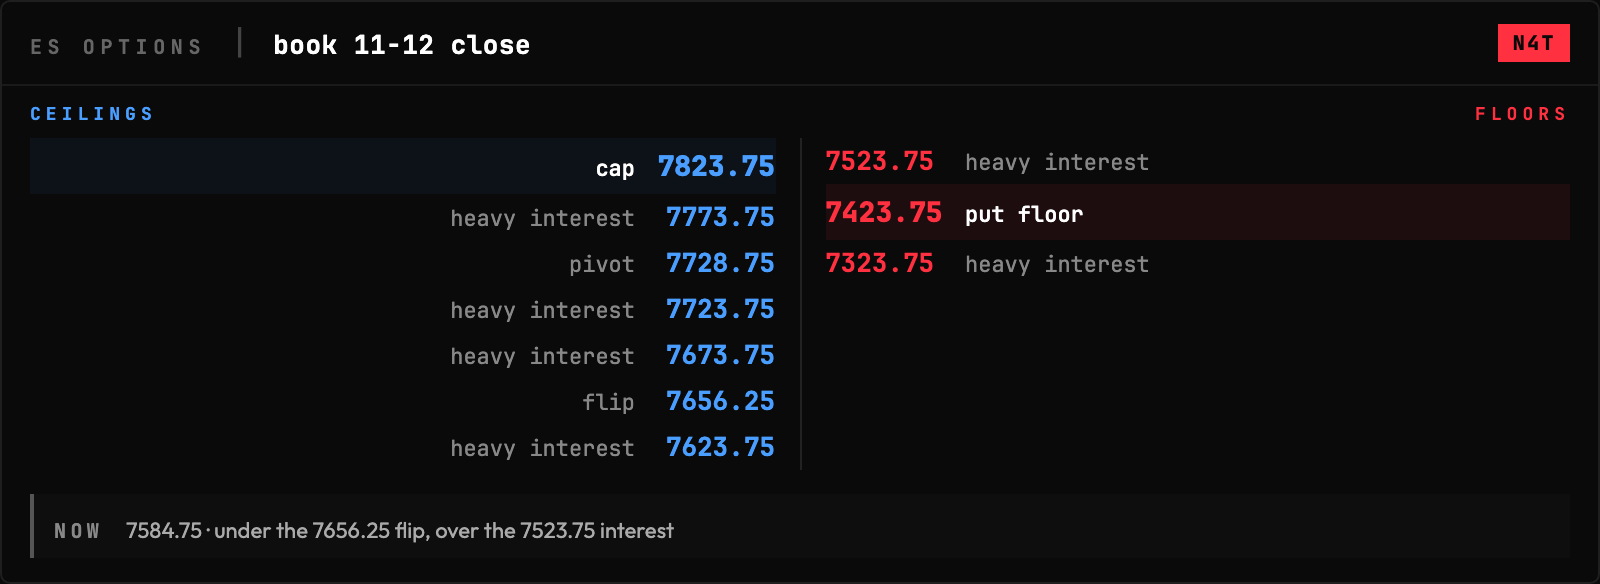
ES: The cap is 7823.75 and the pivot 7728.75, both well over the 7584.75 close, with the 7623.75 interest the first line overhead and the 7656.25 flip just over it. Under price it’s 7523.75, then the 7423.75 put floor, with the book bottoming at 7323.75.
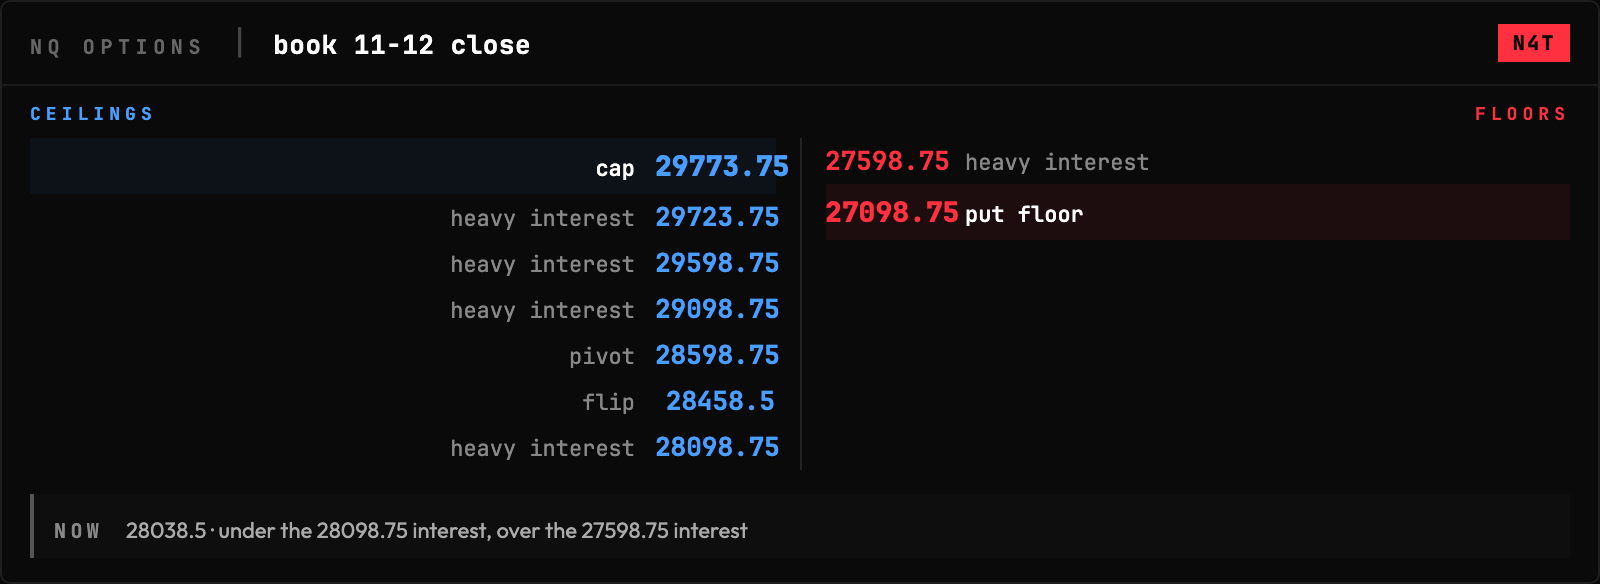
NQ: The 28098.75 interest is the nearest mark over the 28038.5 close, then the 28458.5 flip, the 28598.75 pivot and the 29773.75 cap on top of the stack. Below, 27598.75 is the first interest under price and 27098.75 is where the book bottoms. Price is 28038.5, under the 28098.75 interest and over the 27598.75.
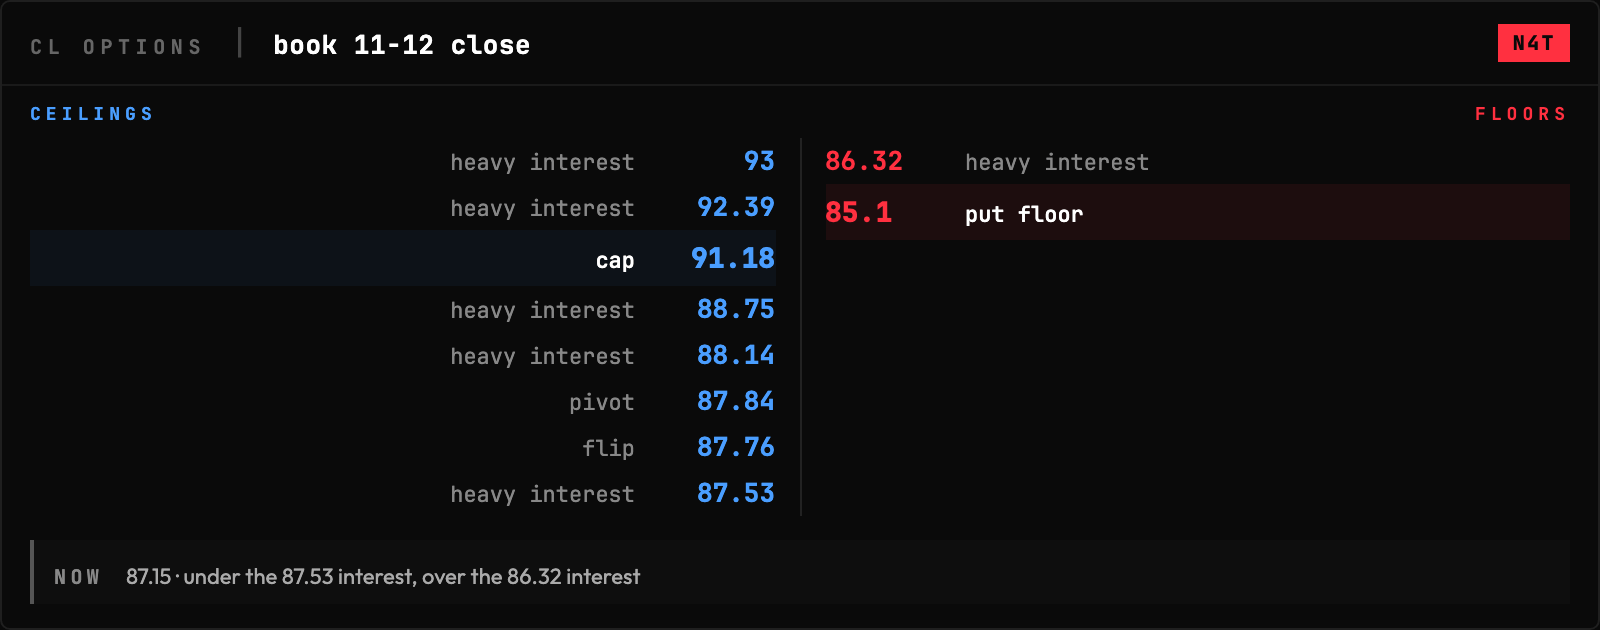
CL: Crude closed 87.15 under the whole stack, with 87.53 the first interest over it, then the 87.76 flip, the 87.84 pivot and the 91.18 cap above the ladder. The 86.32 interest is the first line under and the 85.1 put floor is the book’s floor.
GC: Gold closed 3886.2 under every ceiling the book drew, with the 3887.5 interest a hair over the close, then 3920.4, 3942.3 and 3997.0 into the 4027.8 flip and the 4051.8 cap and pivot sharing a print. Under it, the 3832.8 put floor is the first line with 3778.0 and 3723.2 as the book’s bottom. Price is 3886.2, under the 3887.5 and over the 3832.8.
Vibes for this week.
If this brief is making you money, the best way to back me is to trade with Lucid Trading or FTMO. Use my link or code VIBE.
I am not a financial advisor, CTA, or portfolio manager. Nothing here is a recommendation to buy, sell, or hold anything. Futures trading is not suitable for everyone. You can lose more than your initial investment. Only trade with money you can afford to lose. Past performance does not guarantee future results.
Free orderflow course: course.nick4atick.com | X: @Nick4ATick