


Happy Columbus Day to the bond market, the only corner of this business that gets Monday off. You and I get the banks Tuesday morning, the inflation number Wednesday and a monthly expiration Friday. Last week all four charts sold something and spent Friday buying it back. Gold is the one that changed. It got smoked to 4091.20 Wednesday. Friday it closed at the top of its week, over the ceiling last week built.
The Week That Was
The S&P and the Nasdaq both printed records Tuesday, then spent the next two sessions handing them back with the 10-year sitting near the highest yield it has carried since 2002. Thursday did the damage. Iran stepped up its tanker attacks, a storm shut in Gulf production, crude ripped to 93.20 and the Nasdaq took the worst of the selling. Friday the long end backed off after Thursday’s solid 30-year auction, the dollar slipped, and everything got bought, gold hardest of all.
ES is 7861, on 7859.25, Friday’s POC, and under 7866.75, the ceiling the week put on its value. Tuesday ran 7897.50, just shy of the 7906.25 high August made, and two days of selling dragged it to 7783 Thursday, on 7782, last week’s ceiling. Friday bought every bit of Thursday back, and nothing has traded over 7874.25, October’s value ceiling, since Tuesday.
NQ is 31111.75, a little over 31080, Friday’s POC, and under 31250, the POC this week shares with October. Tuesday printed a record at 31616.50 and by Thursday it had sold to 30792, back into last week’s value under 30840. Friday’s whole session traded under the week’s POC, with 31282.50, last week’s record, parked just over it.
CL is 91.92, a few cents over 91.89, where this week’s value ends, after Tuesday opened on the week’s 87.13 low and Thursday ran it to 93.20. The week built its volume down at 89.50, so Friday closed on top of everything it built, standing on 91.50, a POC Friday and October share, with last week’s 91.44 just under it. That’s a week of headlines that ended with crude agreeing on a price.
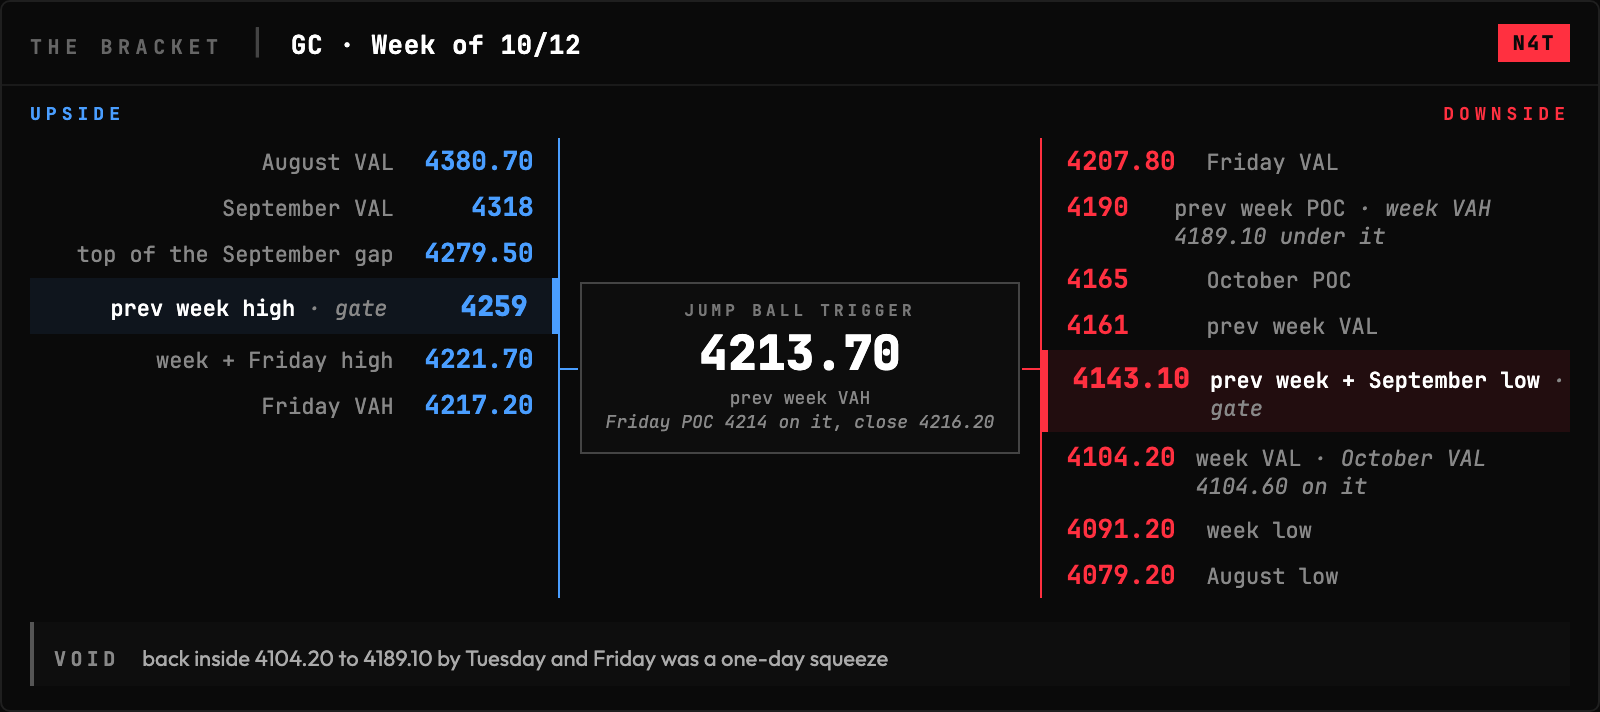
GC is 4216.20, closing Friday a few dollars off its weekly high and over 4213.70, the VAH last week left. Wednesday flushed to 4091.20, just over 4079.20, the low August made, and its value came in lower than last week’s, 4104.20 to 4189.10. Friday opened over all of it and never traded back in, so the close says buyers and the profile still says sellers.
Cross-asset read: ES, crude and gold all closed at or over the upper edge of the value their week built, and NQ is the one that closed under its own week’s POC. Last week NQ was the only chart that closed over everything its week did. This week it’s the only one with its week’s volume sitting overhead.
Positioning (October 6 data): The S&P crowd added shorts again and sits net short better than 129,000 contracts, in a week ES finished green. The Nasdaq crowd bought back most of the longs it dumped the week before and covered shorts too, net long about 57,000 as of Tuesday, the day NQ printed its record. Two sessions later NQ was trading back inside last week’s value.
Vol: VIX went out at 14.84, its lowest close of the week and under last Friday’s 15.31. That’s protection priced for a quiet week, and the next five sessions have the banks, a monthly expiration and two mornings of 7:30 data in them.
The Calendar
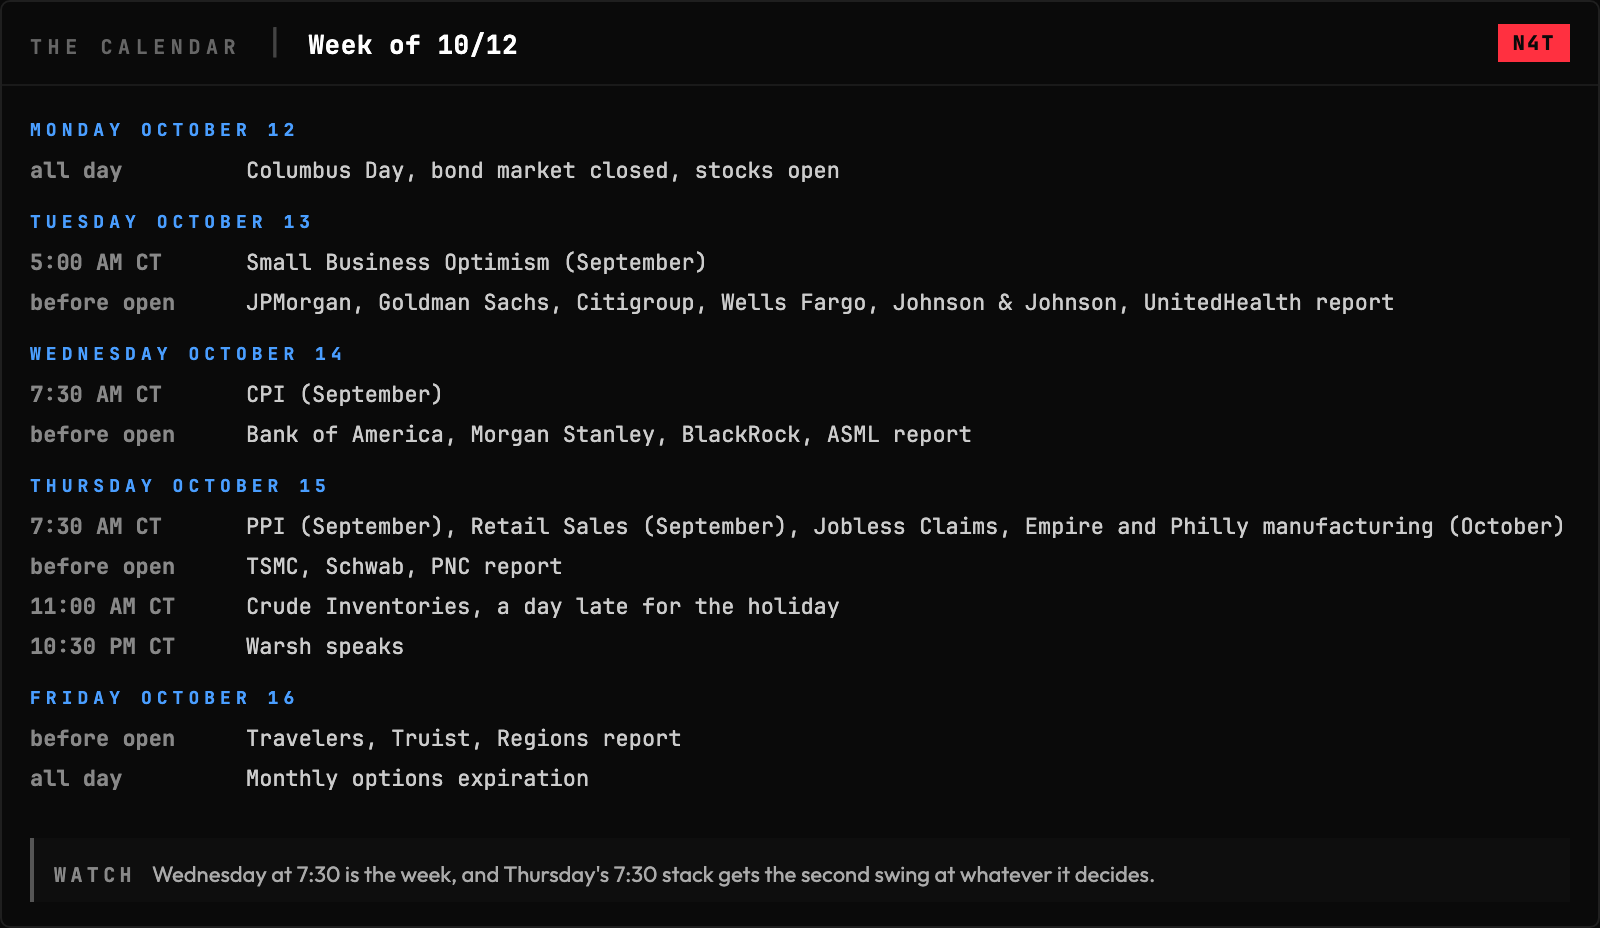
The banks talk first, the 7:30 prints talk loudest, and TSMC Thursday morning is the only read on the chips.
What I’m Watching This Week
1. Wednesday at 7:30. The last inflation number before the end-of-month rate decision, and it lands on a VIX that just went out at the low of its week. The banks report the morning before, so the quarter already has a first draft by 7:30 Wednesday.
2. ES 7866.75. The week and Friday capped their value two ticks apart, 7866.75 and 7867.25, with 7874.25, October’s ceiling, right behind them. No session has closed over that shelf since Tuesday’s run to 7897.50 got sold, so this is where Friday’s repair either keeps going or gets sold the same way.
3. NQ 31250. Two timeframes put their POC on it, this week and October, with last week’s 31282.50 record just over it. Over it, Tuesday’s 31616.50 is the only number left on the map, and under 30978.25, the week’s value floor, last week’s range is next.
4. Crude’s 91.50. Friday and October left their POC on the same price with last week’s 91.44 a few cents under, and crude closed the week standing on all three. Lose it and 89.50, where this week actually traded the most, is the next real volume.
5. Gold’s gap. The hole between last week’s 4259 high and the 4279.50 low before it still hasn’t been touched. Friday closed over last week’s VAH, and that gap is where the buyers find out if Friday was real.
The Week’s Plan
ES:
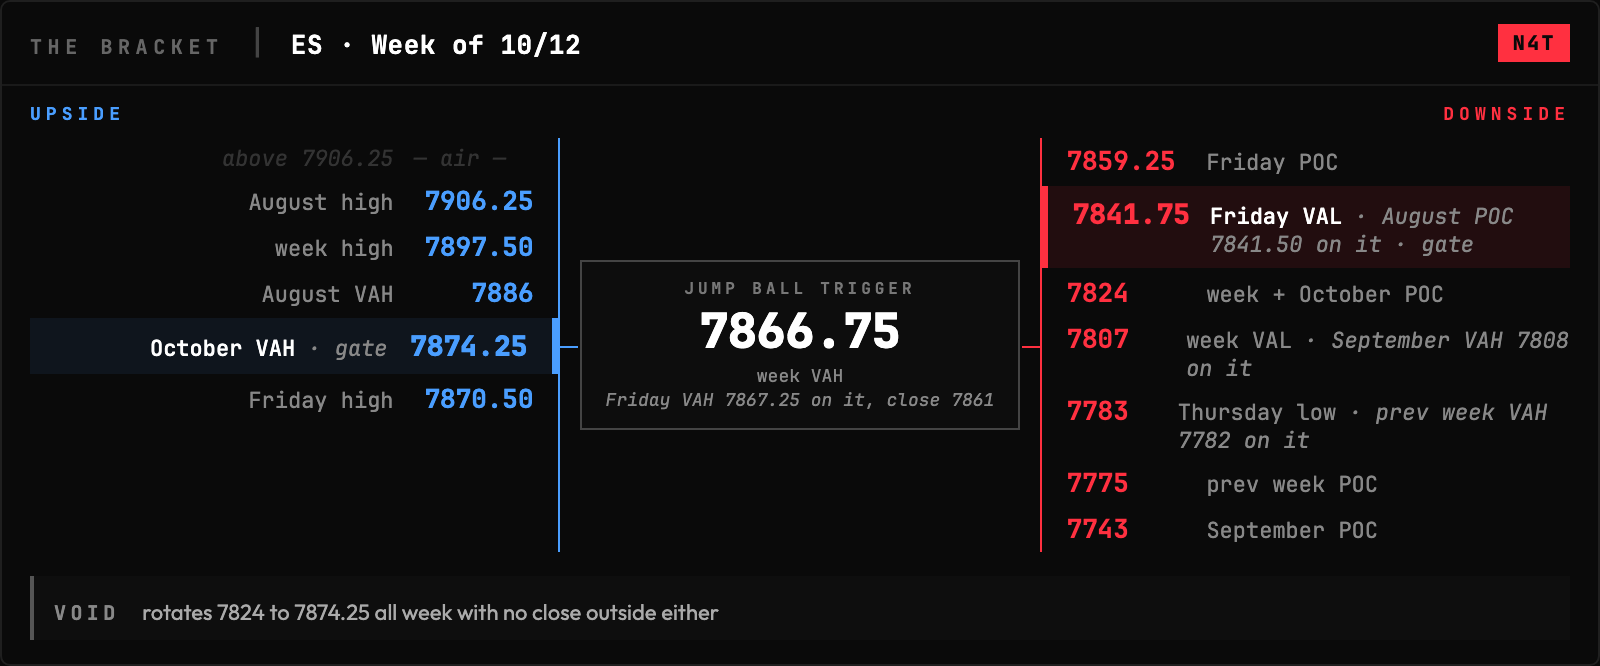
ES is 7861, standing on 7859.25, the price Friday traded most, and the trigger is the shelf right overhead, 7866.75, where the week capped its value with Friday’s 7867.25 ceiling two ticks over it. Twice this week the market went over that shelf and got sold, Tuesday from 7897.50 and Friday from 7870.50, so the sellers get the benefit of the doubt until something closes over it. Take it and 7874.25, October’s ceiling, is the gate, then 7886 where August topped its value. Over those it’s 7897.50, Tuesday’s high, and 7906.25, the high August made, and past that pair the chart is empty. What argues for the buyers is 7824, where this week and October both traded the most, sitting under price instead of over it. Lose 7841.75, Friday’s value floor with 7841.50, August’s POC, a tick under it, and 7824 catches first. Under it 7807, the week’s value floor, has 7808, September’s ceiling, stacked on it. Then 7783, Thursday’s low, sits on 7782, the line last week capped its value at. Give up that pair and 7775, last week’s POC, is the last real volume in front of 7743, the POC September built.
NQ:
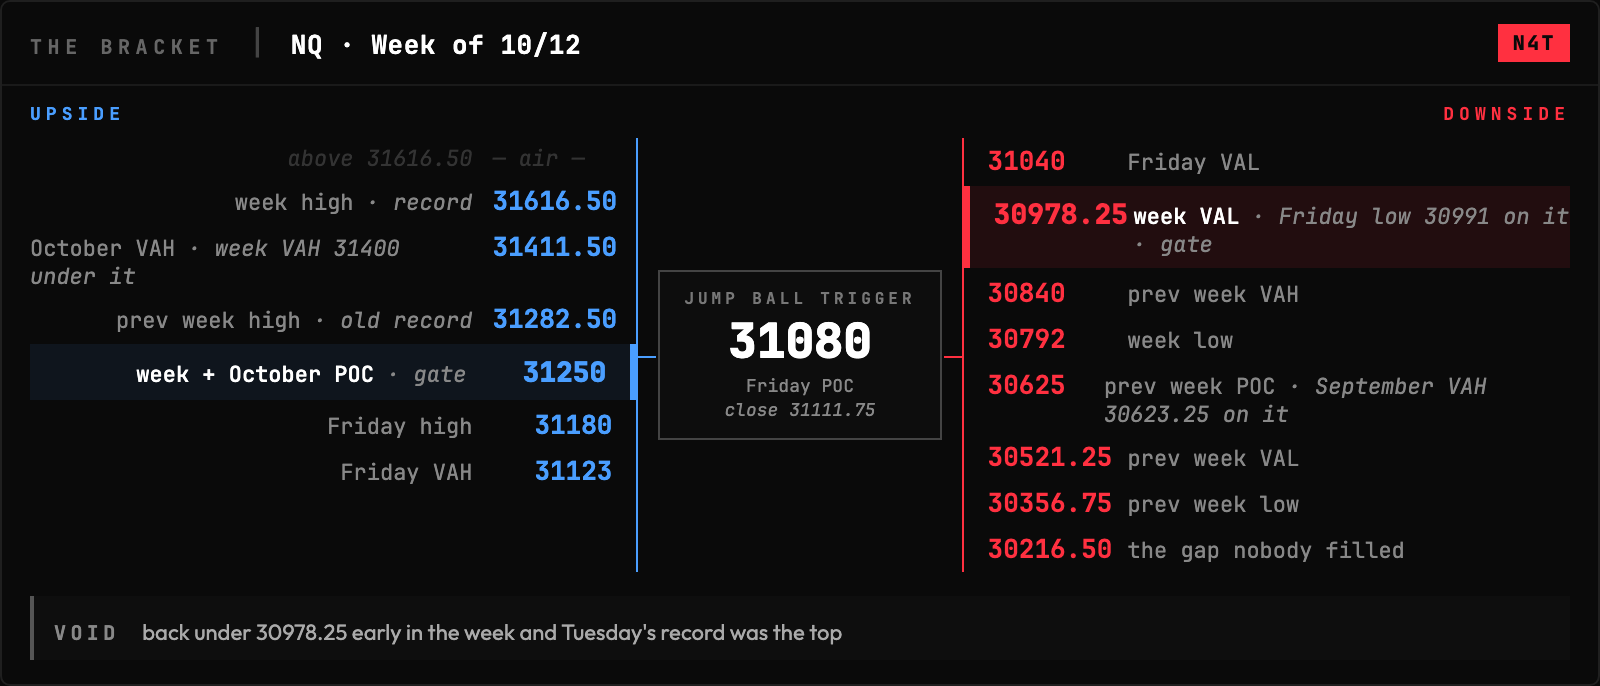
NQ is 31111.75, a little over 31080, Friday’s POC, and that print is the line, with the real work overhead at 31250, the volume shelf for the week and the month, and last week’s 31282.50 record stacked over it. Friday’s whole session traded under that shelf, the only day this week that stayed entirely below it, and that’s the problem with the long side. Take 31250 back and 31282.50 is the first test, then 31400 and 31411.50, the two value ceilings, week and month. Over those 31616.50, Tuesday’s record, is the only thing on the map, and past it the chart is blank. What NQ does have is a floor that already got tested, because Friday’s 30991 low held right over 30978.25, the bottom of the week’s value. Lose 30978.25 and 30840, last week’s VAH, catches first, then 30792, Thursday’s low. Under those 30625, last week’s POC with September’s 30623.25 ceiling on it, is the gate, then 30521.25, last week’s VAL. Below that floor 30356.75, the low last week made, is all that stands in front of 30216.50, the gap that’s been open since September.
CL:
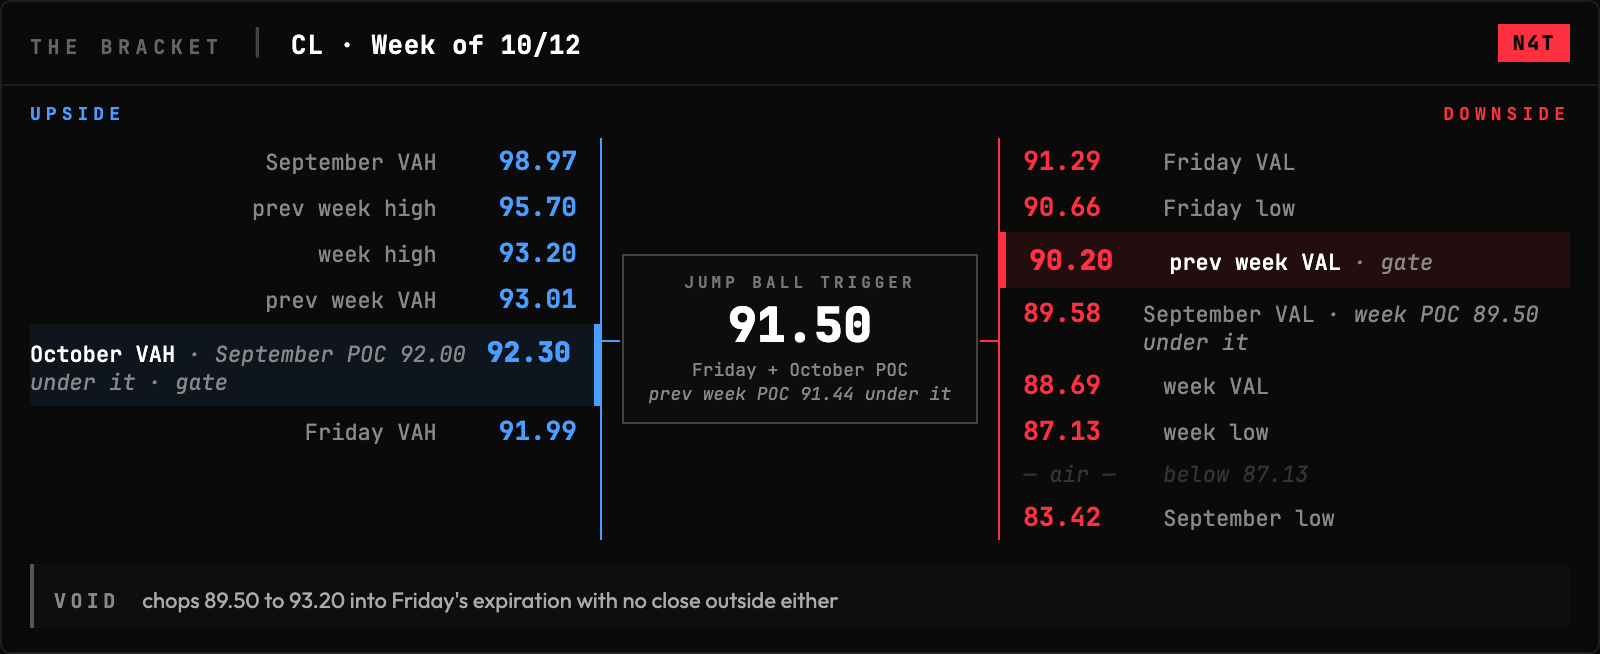
Crude is 91.92, over the 91.44 to 91.50 stack, last week’s POC under the one Friday and October share, and that stack is the trigger. Three timeframes landing inside one dime after a week that ran from 87.13 to 93.20 is crude telling you where it wants to be. What argues against it holding is 89.50, where the most contracts changed hands this week, which leaves everything over 91.89 as a market that only spent two sessions up here. Two sessions is a visit, and crude hasn’t paid any rent over that line yet. Hold 91.50 and 92.00, September’s POC, is the first work, with 92.30, October’s ceiling, the gate right over it. Clear those and 93.01, last week’s ceiling, and 93.20, Thursday’s high, are next, then 95.70, the high last week made. Lose 91.29, Friday’s value floor, and 90.66, Friday’s low, catches, then 90.20, last week’s floor. Under that 89.58, September’s floor, sits right over 89.50, the POC the week built. Below 88.69, the week’s value floor, it’s 87.13, the low Tuesday opened on, and then nothing until 83.42, the low September made.
GC:
Gold is 4216.20, over 4213.70, last week’s VAH, with Friday’s 4214 POC printed right on it, and that pair is the trigger. Friday opened over all five sessions’ worth of value and never traded back into it. The problem is the week itself, which built its value lower than last week’s, 4104.20 to 4189.10, so one good session is sitting on top of a profile the sellers still own. Hold it and 4221.70, the week’s high, is the first job, then the 4259 to 4279.50 gap, last week’s high to the low the week before it, that nobody has traded since September. Fill the gap and 4318, September’s value floor, is the next real volume, with 4380.70, where August’s value starts, behind it. Lose 4207.80, Friday’s value floor, and 4190, last week’s POC, catches with the week’s 4189.10 ceiling on the same shelf. Under that shelf 4165, October’s POC, sits over 4161, last week’s VAL, and 4143.10, the low September and last week share, is the gate. Give up 4143.10 and 4140, this week’s POC, is the last volume before 4104.20, its floor. Under that it’s 4091.20, Wednesday’s low, and 4079.20, the low August made, with nothing under it.
The White Van Stuff
The weight in the books moved this week. The semiconductor book dropped from the 99th percentile of its own year to the 36th and the Nasdaq-100 ETF from the 93rd to the 67th, while the S&P book went from the 69th to the 94th and the Dow’s from the 25th to the 76th. Into Friday’s monthly expiration the S&P book still carries about two puts for every call and the tech book closer to four for every three, while crude’s runs more calls than puts and gold’s runs close to three calls for every put.
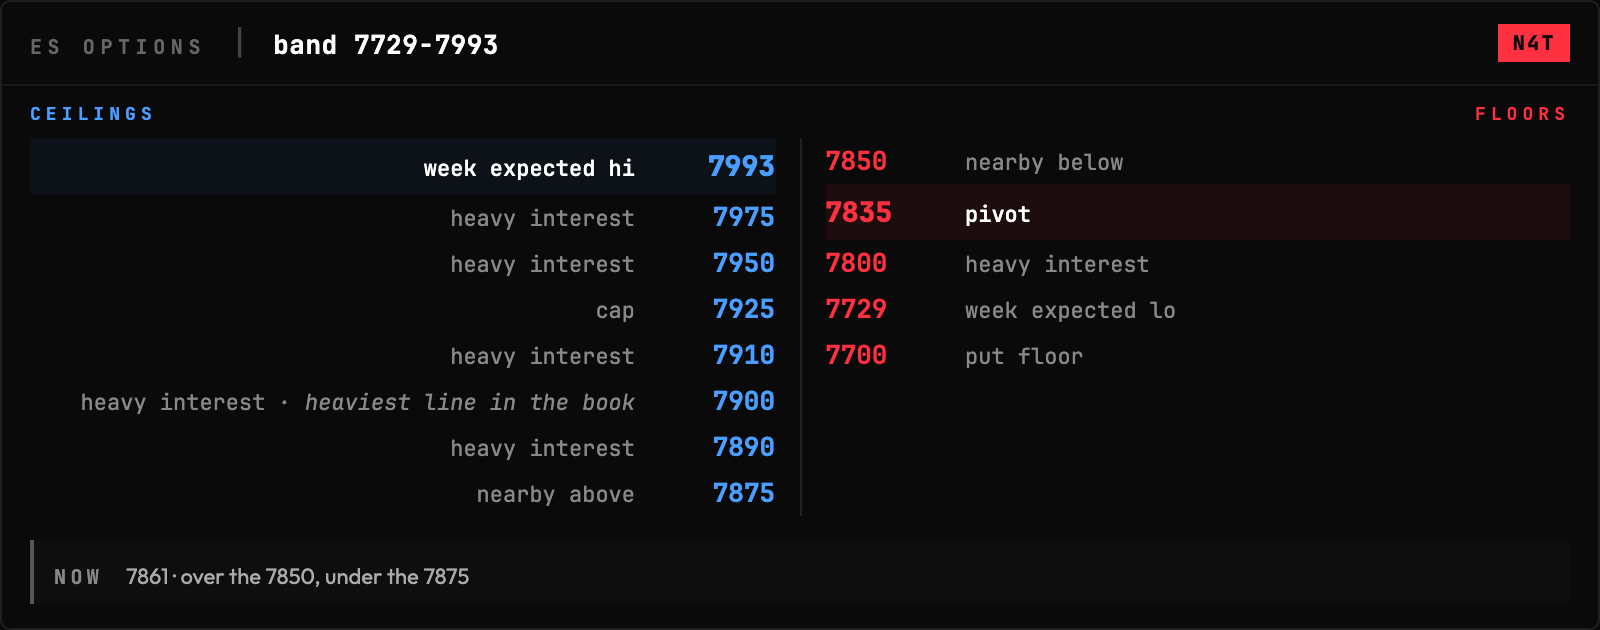
ES: The cap on this book came down to 7925 from 8000, and the biggest number in it is 7900, right under the cap with 7890 and 7875 stacked below it. The pivot moved up to 7835 from 7745, so price closed over it, with 7850 the nearest line underneath and the put floor still 7700. Price is 7861, over the 7850 and under the 7875.
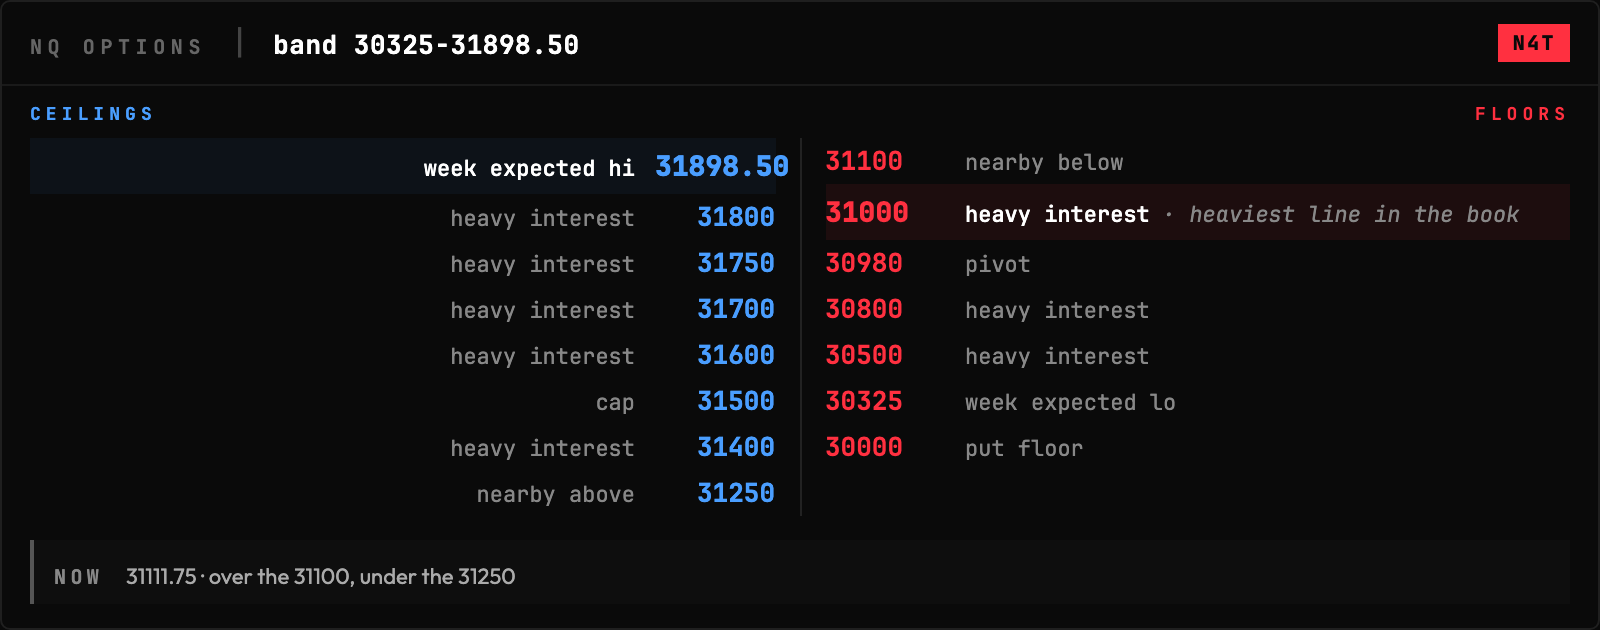
NQ: The cap jumped to 31500 from 31000, and last week’s cap is now the heaviest line in the whole book, 31000, sitting under price with the 30980 pivot right beside it. Overhead it’s 31250 and 31400 before the cap, then a ladder from 31600 out through 31800. Price is 31111.75, over the 31100 and under the 31250.
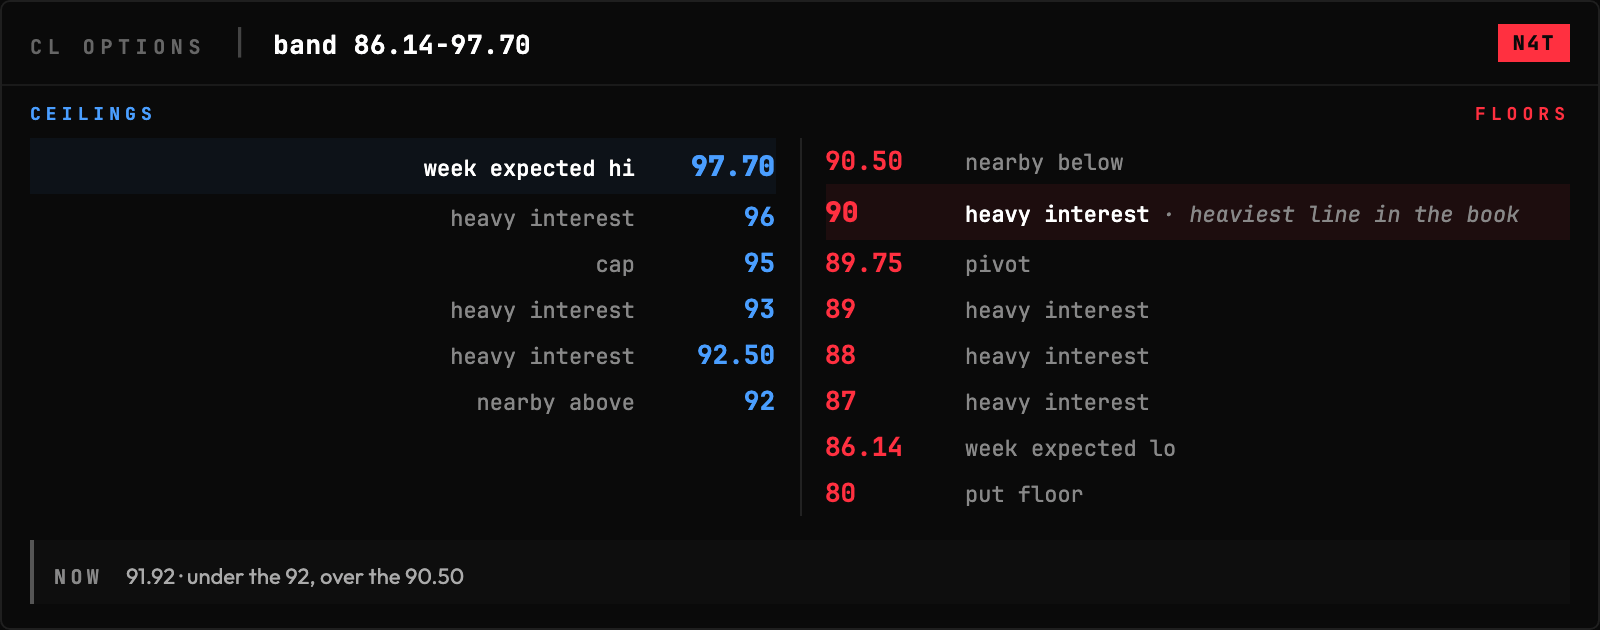
CL: Crude’s cap came down to 95 from 100 and the pivot dropped to 89.75 from 91.50, so the whole cage stepped down under a price that closed the week higher. Most of the interest sits at 90, with 90.50 over it and the 89 through 87 ladder underneath, and overhead it’s 92, 92.50 and 93 before the cap. Price is 91.92, under the 92 and over the 90.50.
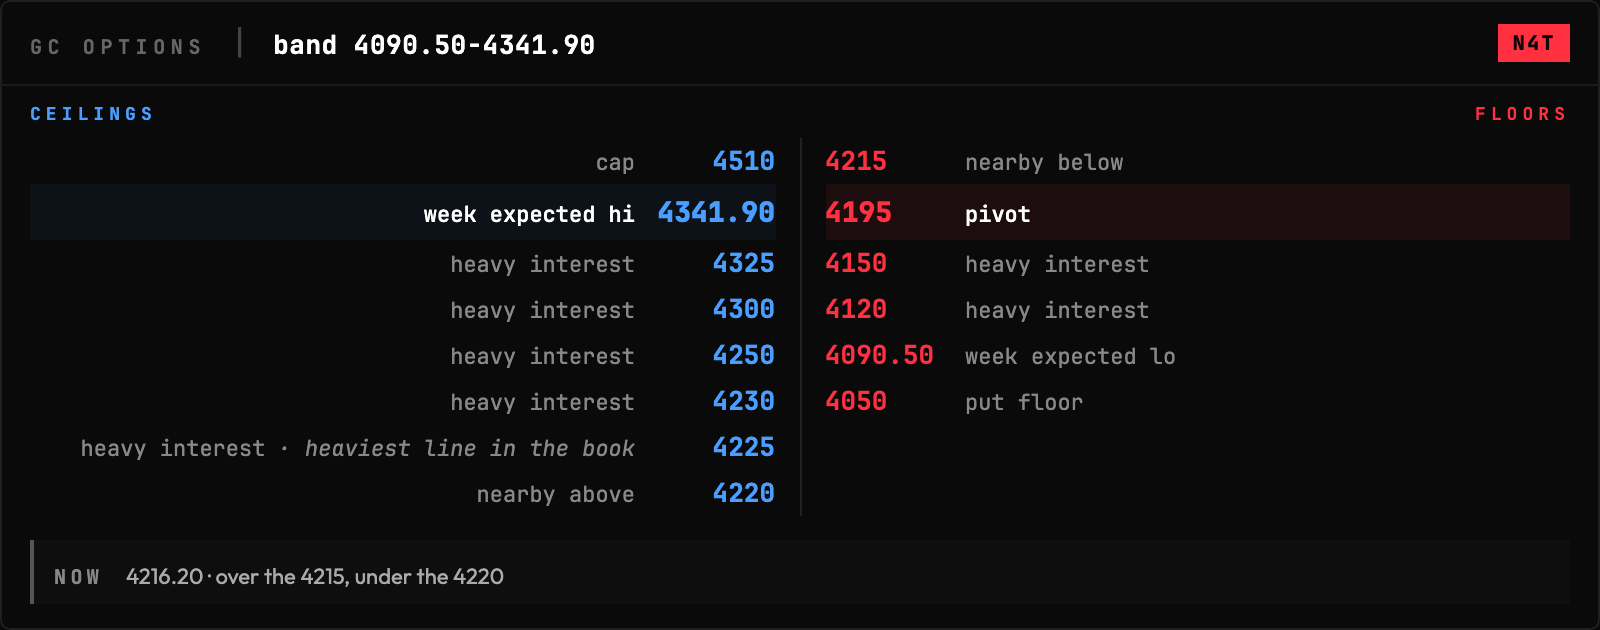
GC: Gold’s pivot fell to 4195 from 4295, so price closed over it, and the weight is at 4225, a few dollars over Friday’s close with 4220 and 4230 packed around it. Overhead it’s 4250 through 4325 and then nothing until the 4510 cap, with 4150 and 4120 under the pivot and the put floor still 4050. Price is 4216.20, over the 4215 and under the 4220.
Be the ball, Danny.
If this brief is making you money, the best way to back me is to trade with Lucid Trading. Use my link or code VIBE.
I am not a financial advisor, CTA, or portfolio manager. Nothing here is a recommendation to buy, sell, or hold anything. Futures trading is not suitable for everyone. You can lose more than your initial investment. Only trade with money you can afford to lose. Past performance does not guarantee future results.
Free orderflow course: course.nick4atick.com | X: @Nick4ATick