


Happy Central Bank Week. Ours goes Wednesday, Europe’s goes Thursday, and Japan’s goes Friday. In the middle of all that Microsoft and Google report Wednesday night, Amazon reports Thursday night and PCE and GDP both land at 7:30 Thursday morning. Last week the chip names got taken out back on Thursday, gold traded under 4000 and crude closed on the high of the month. ES and NQ both went out sitting just over their October lows. Futures are green tonight, which is nice, and means nothing to me until one of these charts takes a level back.

The Week That Was
The selling this week had one address, and it was the chip names. Meta reported Wednesday night, raised its spending plans again and showed negative free cash flow, and Thursday the semiconductor index fell close to 7% while the Nasdaq had its worst day since June. The S&P and the Nasdaq both went out red for a second straight week, the Dow went out green and small caps ran 2% Friday, so the money left the chips and went shopping everywhere else. Crude ran the whole week on attacks on Saudi Arabia stacked on top of the Iran war, Brent printed its highest prices since April and WTI went out over 103. Gold sold from Monday’s open into Friday and traded under 4000. Nobody expects a move Wednesday after September’s hike, and the hike bets that sat on this meeting a month ago have moved out to December.
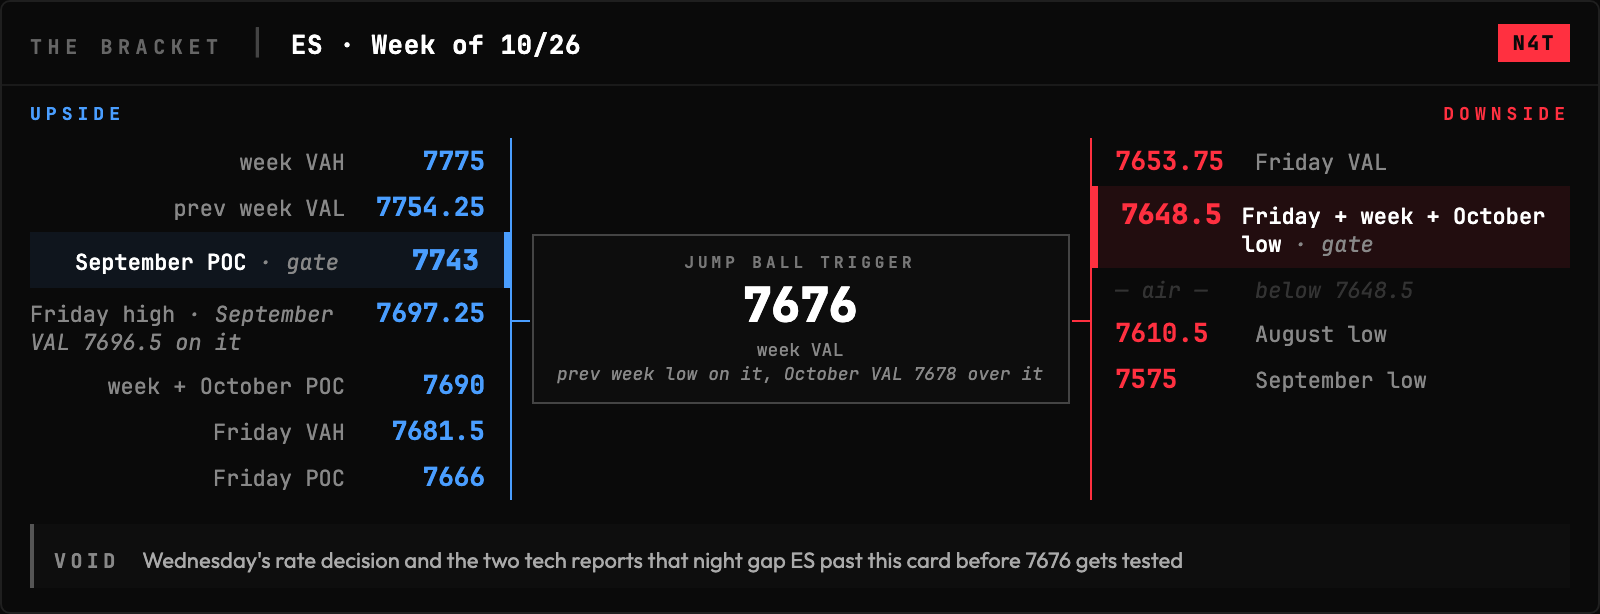
ES is 7661, just under Friday’s 7666 POC and under 7676, the week’s VAL, with Friday’s 7648.5 low under it, the week’s low and October’s. It opened the week at 7741.5, tagged 7812.25 and spent the rest of it giving that back, with the volume up at 7690 on October’s POC. The week’s value floor landed on the exact tick last week bottomed, so two weeks of selling share one line.
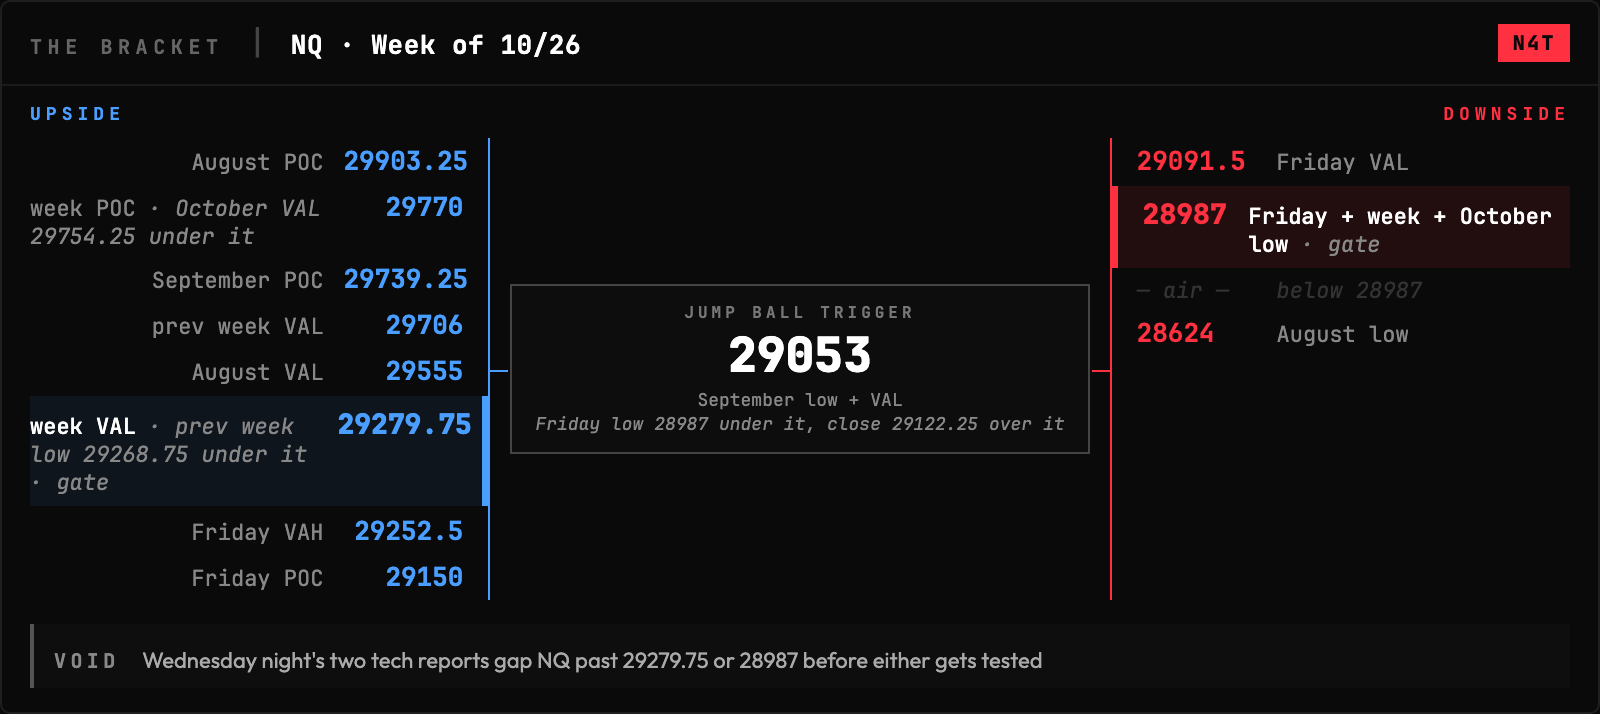
NQ is 29122.25, under Friday’s 29150 POC and back over 29053, September’s low, after Friday flushed through it to 28987, a new low for the month. The week opened 29778.5, topped at 30113 and built its volume at 29770, so Thursday’s chip selloff dragged the whole auction a value area lower. That September low is the first price all week anybody defended.
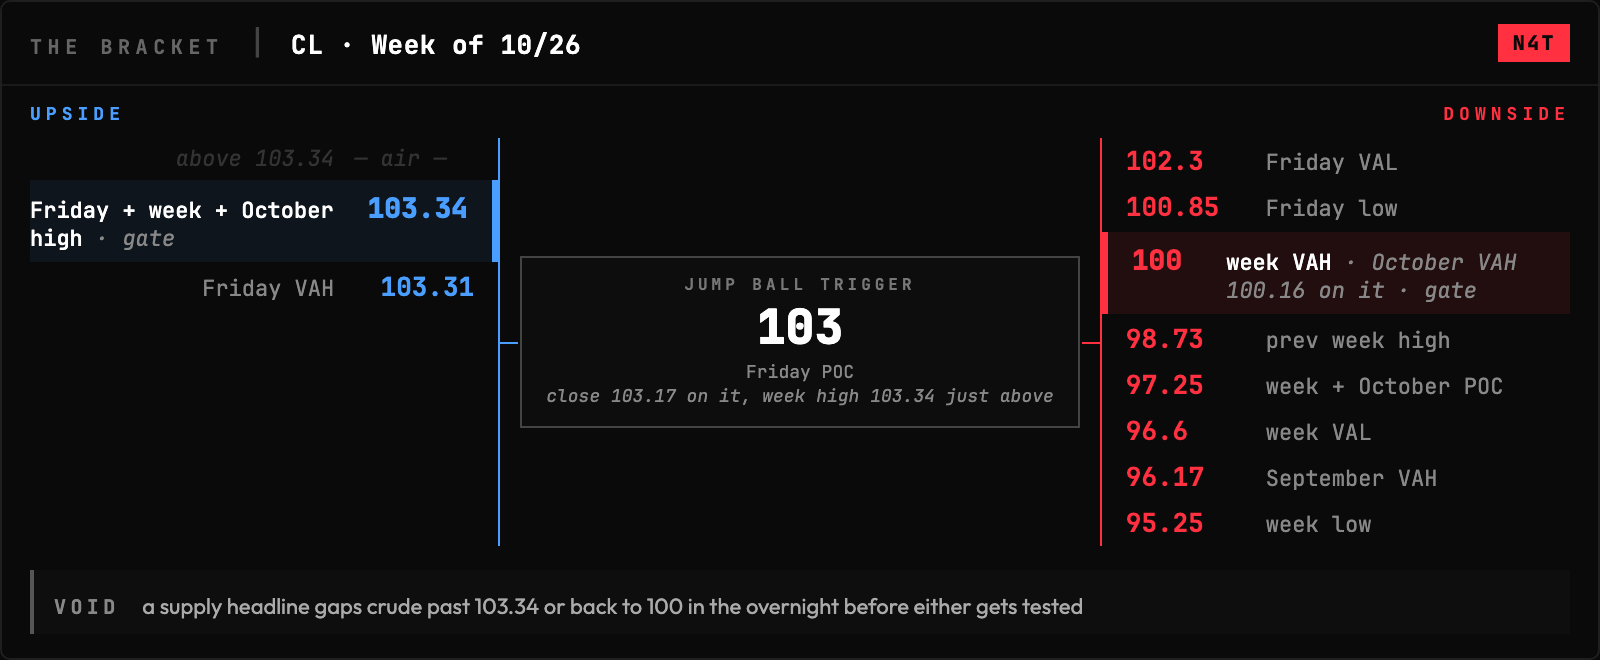
CL is 103.17, a few cents under 103.34, the high of the month, printed Friday. Friday built its value at the very top, 102.3 to 103.31 around a 103 POC, while the week’s volume sits back at 97.25 with October’s POC sharing the number. It opened the week at 97.8, dipped to 95.25 and closed it over 100, the ceiling of the week’s own value. Buyers chased it into the weekend and never let it come back to where the week did its business.
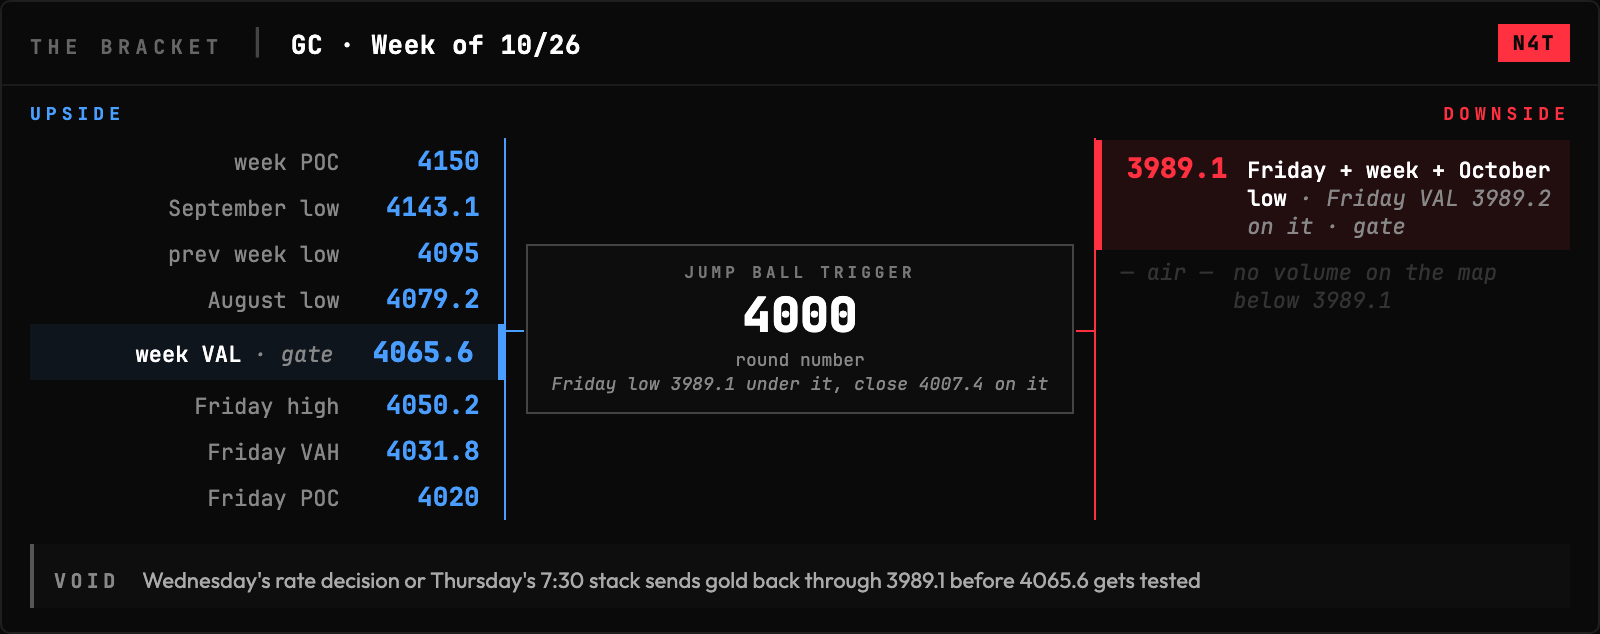
GC is 4007.4, a hair over 4000 after Friday printed 3989.1, a new low for October and under every low August and September made. It opened the week at 4184.2 and the value it built sits way up at 4065.6 to 4187.7 around a 4150 POC, all of it over the close. Friday did its business at 4020, and its value floor and its low print a tick apart.
Cross-asset read: Both indexes went out just over their October lows and under the value their week built, and NQ is the one that already went through a September low while ES is nowhere near its own. Crude finished the week at the top of October’s range and gold finished it at the bottom, the two of them going opposite ways all week.
Positioning (October 20 data): The S&P crowd covered about 3,800 shorts, sold about 1,600 longs and still sits net short better than 115,000, which put them on the right side of a second red week. The Nasdaq crowd added about 3,400 longs two sessions before the worst Nasdaq day since June and sits net long a little over 47,000.
Vol: VIX went from 19.99 last Friday down to 16.68 Wednesday, popped to 19.03 on the chip day and went out at 19.45, lower than where it started a week that took the Nasdaq down. That’s cheap protection for a week with this much on the calendar, so size down until the decision is out of the way.
The Calendar
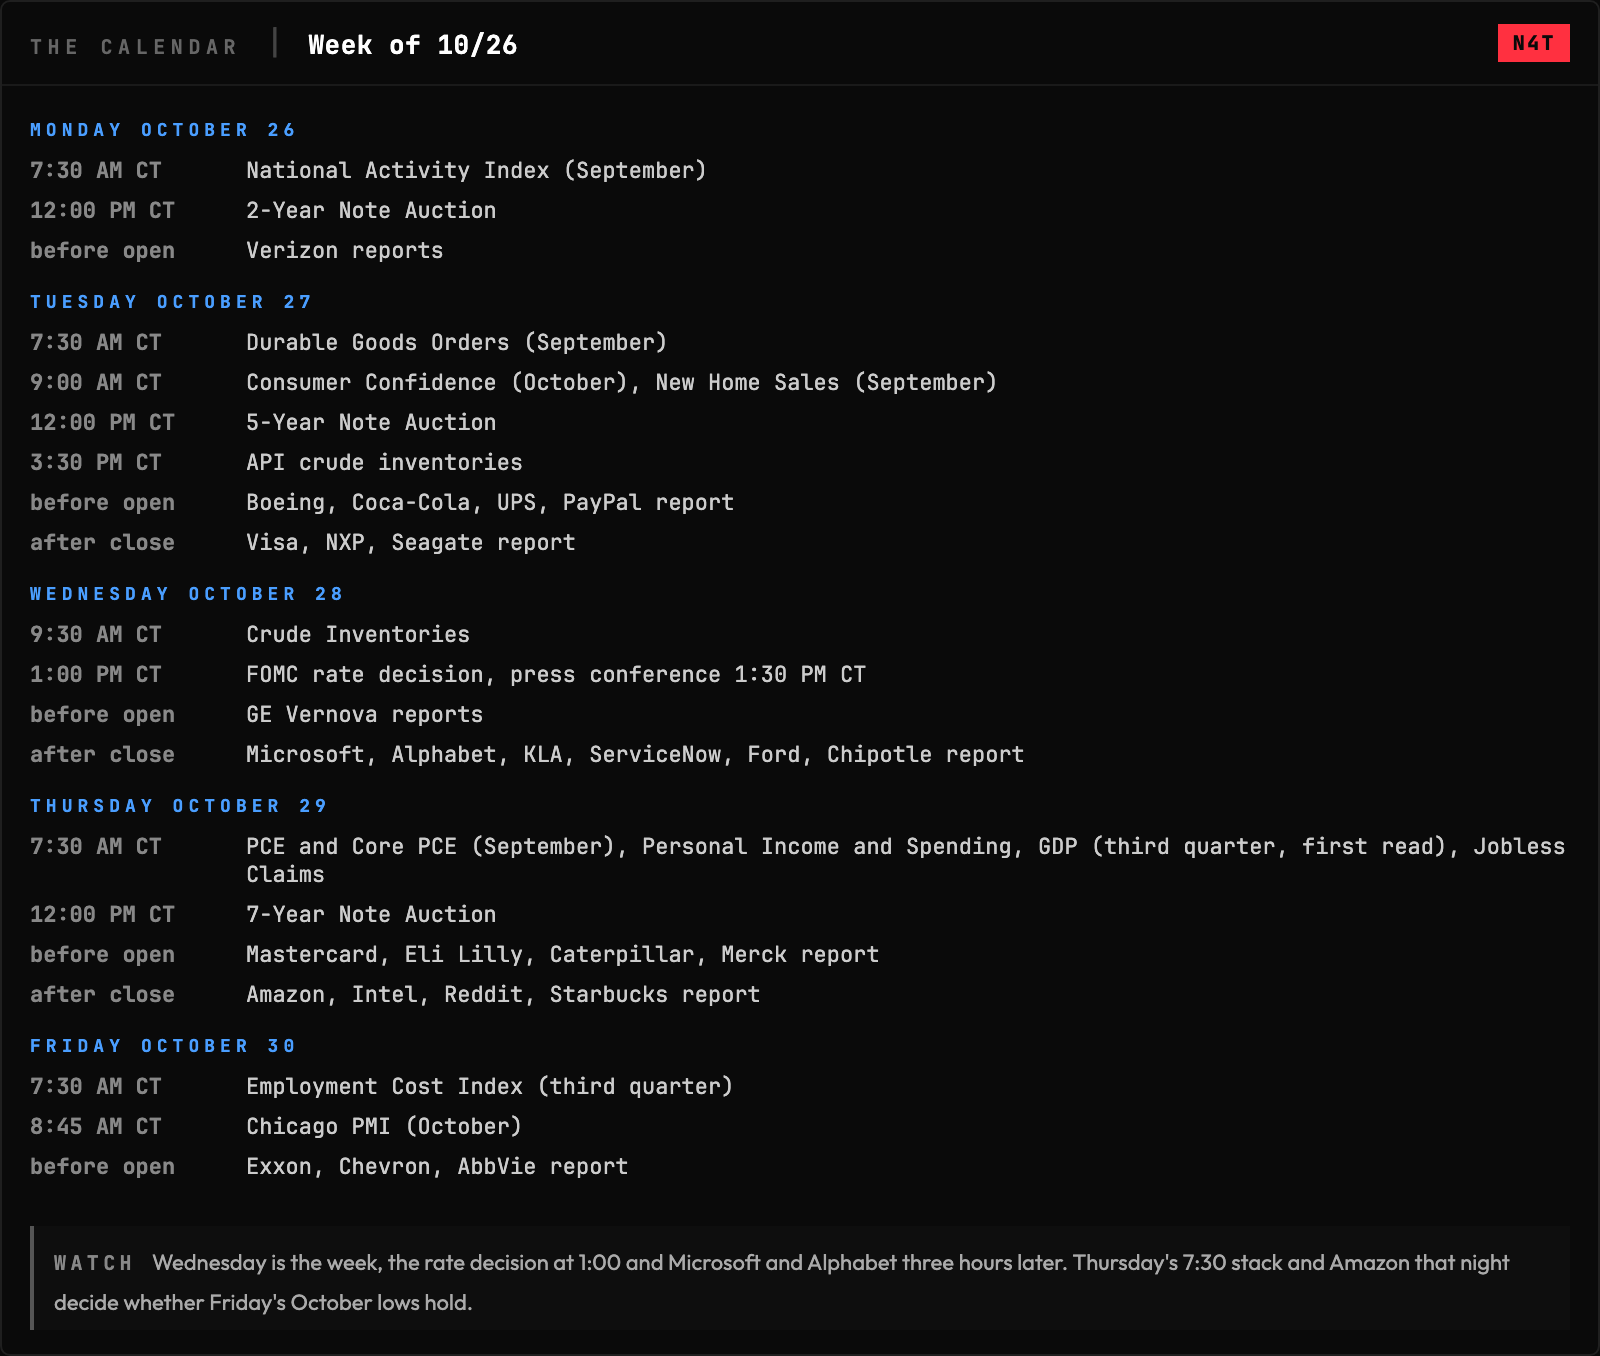
Three of the biggest names in the Nasdaq report across two nights, and the first two go three hours after the rate decision.
What I’m Watching This Week
1. Wednesday at 1:00 and the three hours after it. A hold is priced and the hike bets already moved to December, so the decision is the easy part. Whatever the press conference says about December lands right before Microsoft and Google report, and NQ gets both answers in one night.
2. ES 7676. The week’s value floor, printed on the same tick as last week’s low, with October’s value floor at 7678 sitting on top of it. Back over that pair and Friday’s trip to 7648.5 was a flush into the month’s low. Stay under it and 7648.5 is all that stands in front of 7610.5, the low August made.
3. NQ’s September low. Friday traded through 29053 to 28987 and closed back over it. Lose it a second time and NQ is under September’s whole range with nothing structural until 28624.
4. Crude at the top of the map. Friday built its value from 102.3 to 103.31 and closed inside it, with the week’s volume back at 97.25 and no profile anywhere over 103.34. Wednesday’s inventory number is the only supply fact on the schedule, and one headline is enough to reprice this chart overnight.
5. Gold under 4000. 3989.1 is the lowest price on my gold map and Friday closed a hair over the round number. 4065.6, the bottom of this week’s value, is the reclaim, and under 3989.1 there’s no volume to stop anything.
The Week’s Plan
ES:
ES is 7661, just under Friday’s 7666 POC, and the line overhead is 7676, the week’s VAL, right where last week’s low sits. With October’s value floor at 7678 sitting on it, that’s two weeks and a month of sellers drawing one line, and it’s the trigger. Take it back and the work is 7690, where the week and October both built their volume, then 7697.25, Friday’s high, with September’s 7696.5 value floor printed on it. Through that the gate is 7743, September’s POC, and past it 7754.25 where last week’s value began and 7775, the ceiling of this week’s. What argues against a bounce is where it closed, inside Friday’s value but under every value area the week, October and September built. Lose 7653.75, Friday’s value floor, and 7648.5 is the gate, the low Friday printed for the whole month. Under it there’s air to 7610.5, August’s low, and then 7575, where September bottomed.
NQ:
NQ is 29122.25, under Friday’s 29150 POC and back over 29053, September’s low, after Friday ran through it to 28987 and the selling dried up. That reclaim is the trigger, because a monthly low that breaks and gets bought back inside one session is the one thing the buyers can point to from this week. Hold 29053 and the first work is 29150 and 29252.5, Friday’s POC and value ceiling. Then 29279.75 is the gate, the week’s value floor with last week’s 29268.75 low printed right under it. Through the gate it’s 29555, August’s value floor, then 29706 where last week’s value began and 29739.25, September’s POC. The case against trusting a bounce is that the week did its business up at 29770, so every one of those levels runs into longs who bought this week and want out. Lose 29053 and 28987 is the gate, Friday’s low and October’s. Under it there’s no structure until 28624, the low August made.
CL:
Crude is 103.17, sitting on 103, the POC of the value Friday built right at the top, with 103.34 overhead, the high of Friday, the week and October on one print. 103 is the trigger because Friday is the only session that traded up here, and over 103.34 there’s no profile on my map at all. Hold 103 and the next print through 103.34 is new territory, where the only levels are the ones the tape builds that day. What argues against chasing it is that the week’s volume sits back at 97.25 with October’s POC sharing it, and that’s where the market actually agreed to trade crude. Lose 102.3, Friday’s value floor, and 100.85, Friday’s low, catches first. Under it the gate is 100, the week’s VAH, with October’s 100.16 on it. Give up the gate and it’s 98.73, last week’s high, then 97.25, the volume the whole month sits on. Under that it’s 96.6, the week’s VAL, then 95.25, the week’s low.
GC:
Gold is 4007.4, a hair over 4000 after Friday printed 3989.1, under every low August and September made and the lowest price on this whole map. 4000 is the trigger because it’s the round number Friday broke and bought back, with Friday’s value floor and its low printed a tick apart right under it. Hold 4000 and the first work is 4020 and 4031.8, Friday’s POC and value ceiling, then 4050.2, Friday’s high. The gate is 4065.6 where the week’s value bottomed, and through it 4079.2, the low August made, then 4095 where last week bottomed. Past those it’s 4143.1, September’s low, with the week’s 4150 POC sitting right on it. The problem for the long side is the open, 4184.2, because the whole week’s volume sits overhead and nobody who bought it has been paid once. Lose 3989.1 and there’s nothing, no volume anywhere under it on this map.
The White Van Stuff
The weight in the books moved toward the beaten-up corners, with the semiconductor book going from the 3rd percentile of its own year to the 15th and small caps from the 16th to the 26th, while the Dow book slid from the 53rd to the 37th, Netflix from the 25th to the 4th and gold’s from the 30th to the 6th. Into Friday’s expiration the S&P book carries better than two and a half puts for every call and the Nasdaq book about two, while crude and gold each carry about one put for every two calls. The index crowd is paying for protection under a market that already fell, and the commodity crowd is still buying upside in a crude chart at the top of its month and a gold chart that sold all week.
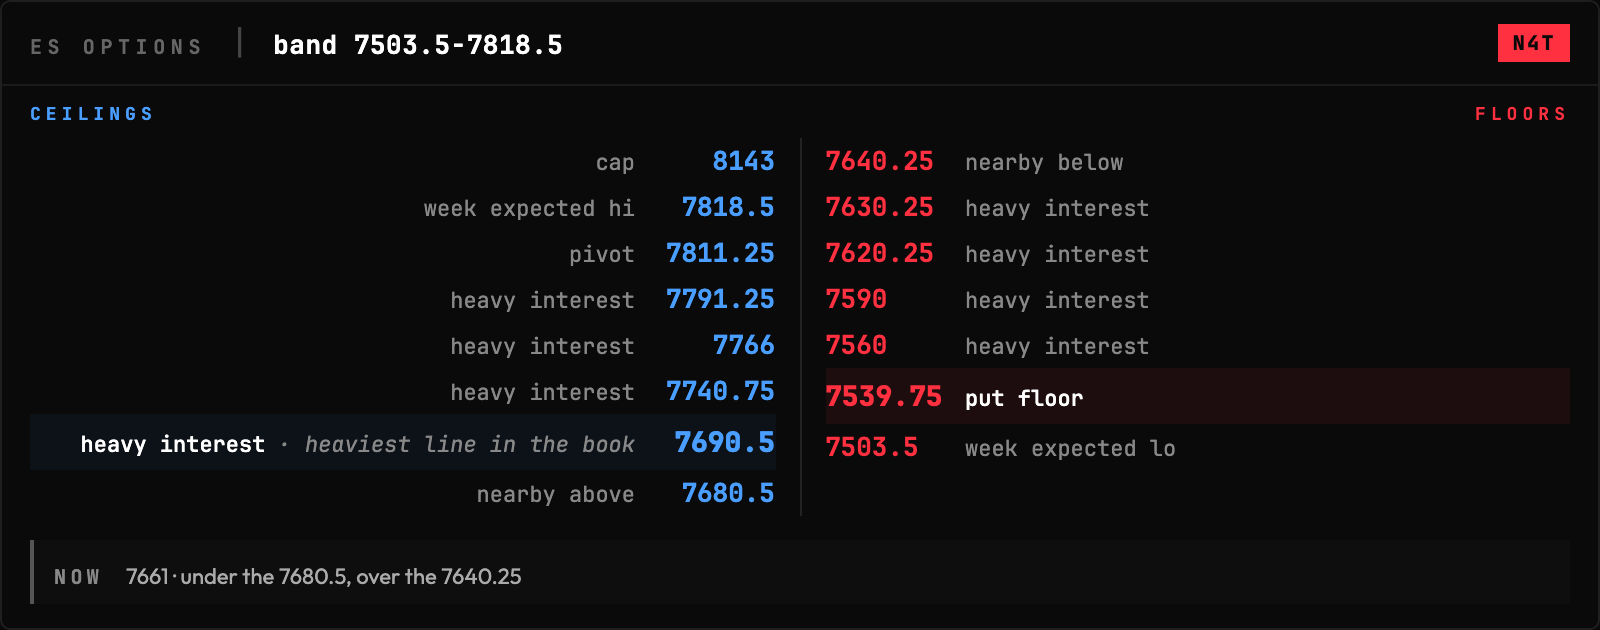
ES: The heaviest line in the book is 7690.5, right on the price the week built its volume, and it sits over price now with the 7680.5 strike under it. The pivot is all the way up at 7811.25 on top of the week’s high, and the put floor is 7539.75 with the week band running 7503.5 to 7818.5. Price is 7661, under the 7680.5 and over the 7640.25.
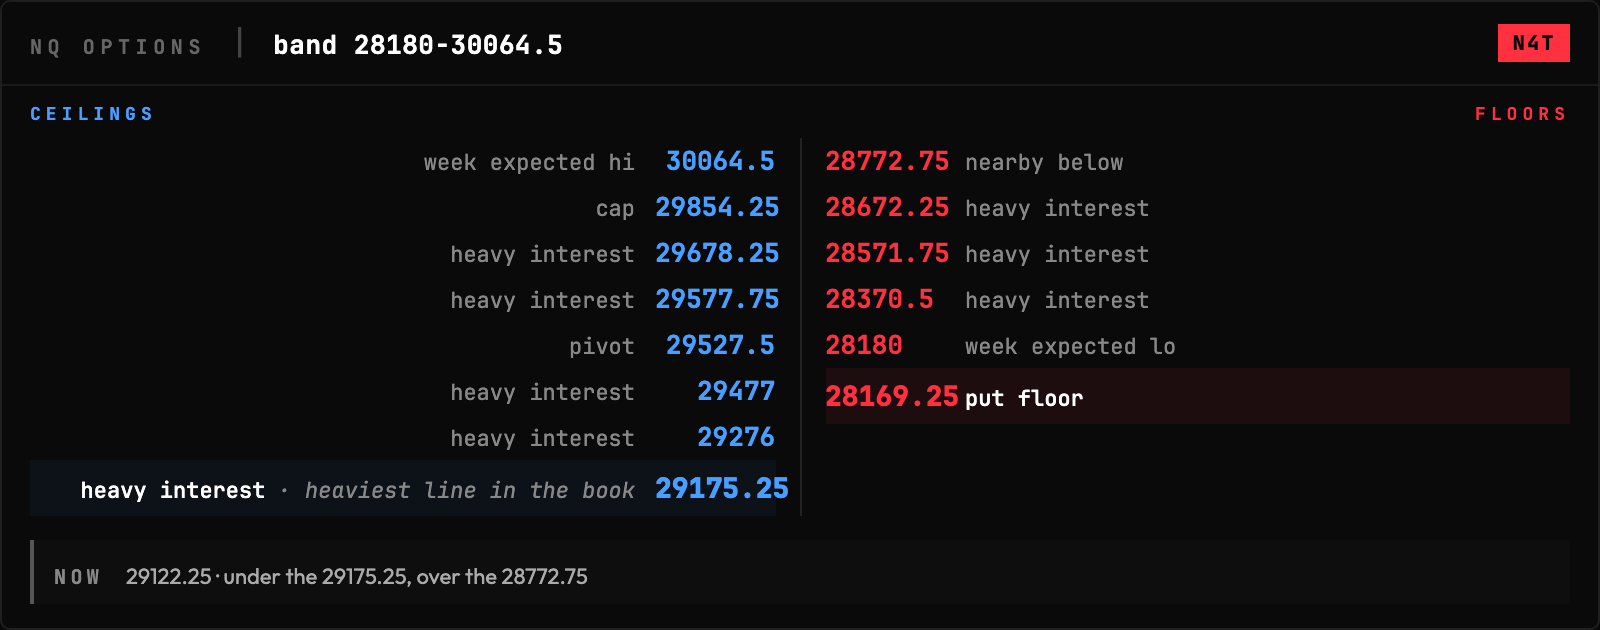
NQ: The heaviest line in the book is 29175.25, sitting right over Friday’s close, with 29276 through 29678.25 stacked above it, the 29527.5 pivot inside that ladder and the 29854.25 cap on top. Under price there’s nothing with weight until 28772.75, and the put floor at 28169.25 sits right on the week band’s floor at 28180. Price is 29122.25, under the 29175.25 and over the 28772.75.
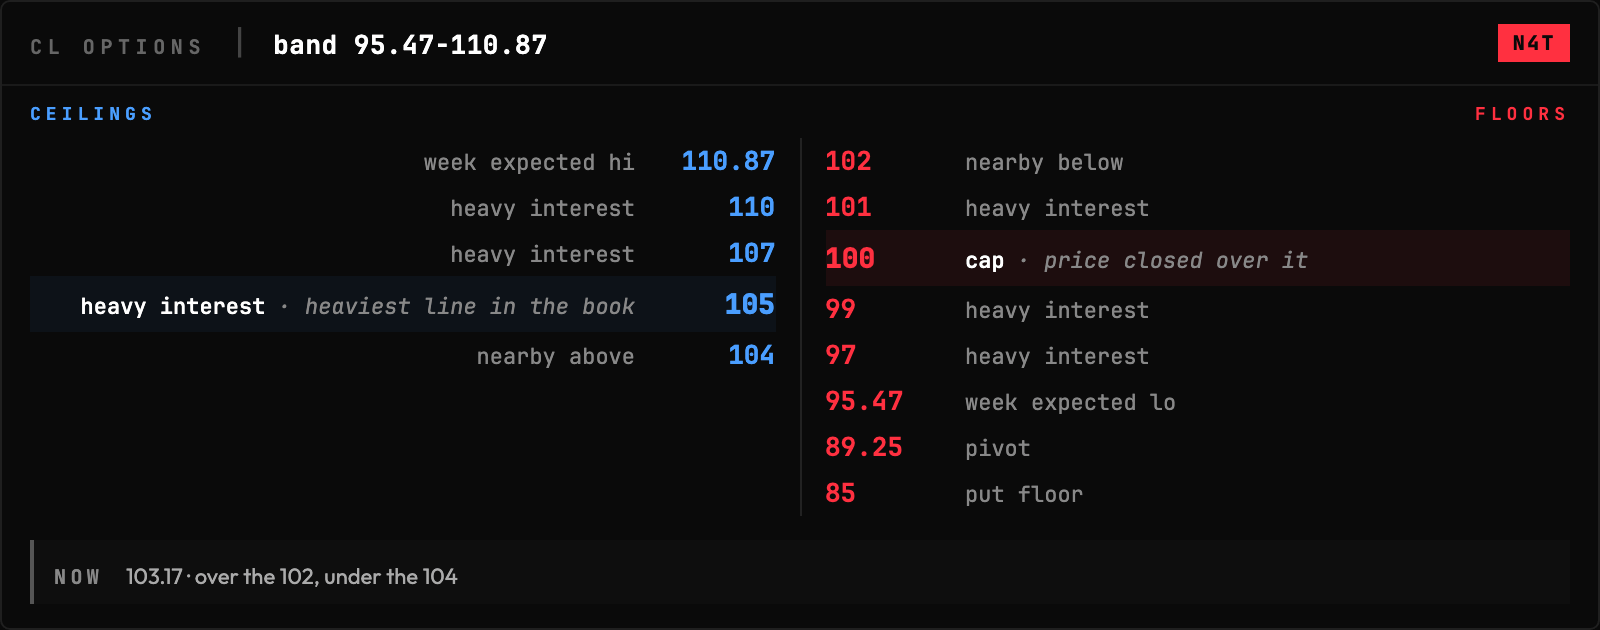
CL: Crude closed over its own 100 cap, so the line the options crowd drew as the ceiling is under price now, with 101, 102 and the 99 strike stacked around it. The heaviest line in the book is 105 overhead, then 107 and 110 under the 110.87 top of the week band, and the pivot is way down at 89.25 with the floor at 85 under it. Price is 103.17, over the 102 and under the 104.
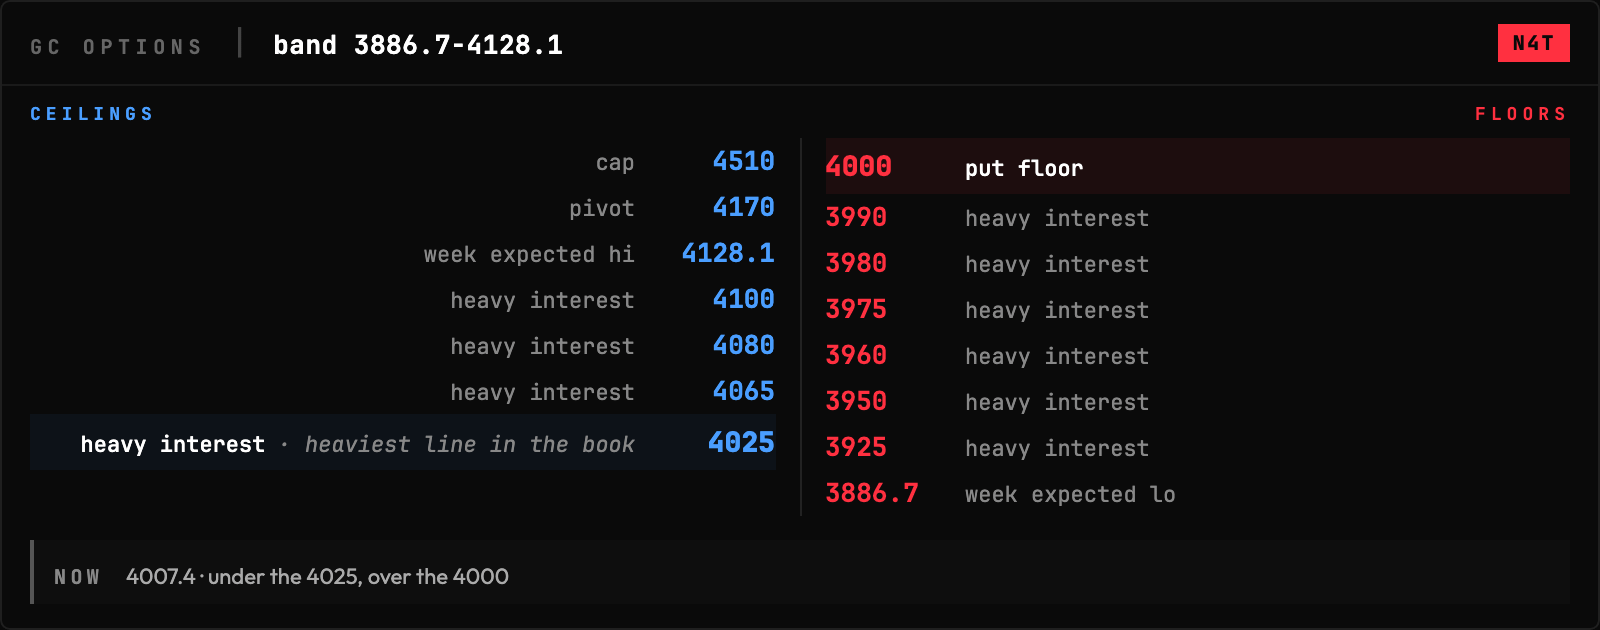
GC: Gold’s heaviest line is 4025, just over the close, and the 4000 put floor is the line Friday broke and closed back over. Under it there’s a ladder from 3990 down to 3925, with the week band bottoming at 3886.7, and overhead it’s 4065, 4080 and 4100 under the 4170 pivot. Price is 4007.4, under the 4025 and over the 4000.

If this brief is making you money, the best way to back me is to trade with Lucid Trading or FTMO. Use my link or code VIBE.
I am not a financial advisor, CTA, or portfolio manager. Nothing here is a recommendation to buy, sell, or hold anything. Futures trading is not suitable for everyone. You can lose more than your initial investment. Only trade with money you can afford to lose. Past performance does not guarantee future results.
Free orderflow course: course.nick4atick.com | X: @Nick4ATick