


NFL Sunday and a Fed week. Best and worst thing that can land on my schedule in the same seven days. Monday through Thursday this tape looked like the top was in. Then Friday showed up and took a big chunk of it back, so everything that felt settled Thursday afternoon is an argument again. Wednesday at 1:00, September expiration Friday, and all four of my charts parked on a line going into it.
The Week That Was
Four straight down sessions had the S&P lower by about eight tenths on the week. Friday put most of a percent back on the board in one day and snapped the streak. Underneath all of it was crude, which opened the week at 92.26 and printed 104.46 while the Strait of Hormuz stayed shut, then dumped Friday when Iran and Oman started talking about an interim shipping corridor. Gold went the other way for a second straight week and closed under its own value again. The Fed meets Tuesday and Wednesday with the decision at 1:00 Wednesday, and no first-tier data and no big tech print shows up all week to compete with it.
ES is 7660.75, sitting on 7660.50 where Friday’s value bottomed, with the week’s 7675.75 ceiling right overhead and 7679, September’s POC on last week’s, above that. The week opened 7715.50, walked down to 7585.50 by Thursday and left its POC at 7598.50 near the low, then Friday built its entire value up at 7660.50 to 7679.50. The week put its volume at the bottom and Friday put its volume at the ceiling, and those two have not been introduced yet.
NQ is 29391.75, between the 29350 floor of its week’s value and the 29450 print the week actually built on, which is about as undecided as a chart gets going into a Fed. Friday morning it took the week low at 29040.50, which is the exact price September’s value area begins at, and then closed near the top of its own range. The month’s floor got tested to the tick and bought, and that is the one thing on this chart I am carrying into Monday.
CL is 99.99, a penny under the hundred, where the week left its POC at 100.05, Thursday left its POC at 100.05, and the cap in the options book sits at 100. The week opened at 92.26, ran 104.46 Friday morning, and sold to 98.48 the moment anybody mentioned talks. The whole week traded above everything September built, so crude is the only chart on my board in real price discovery.
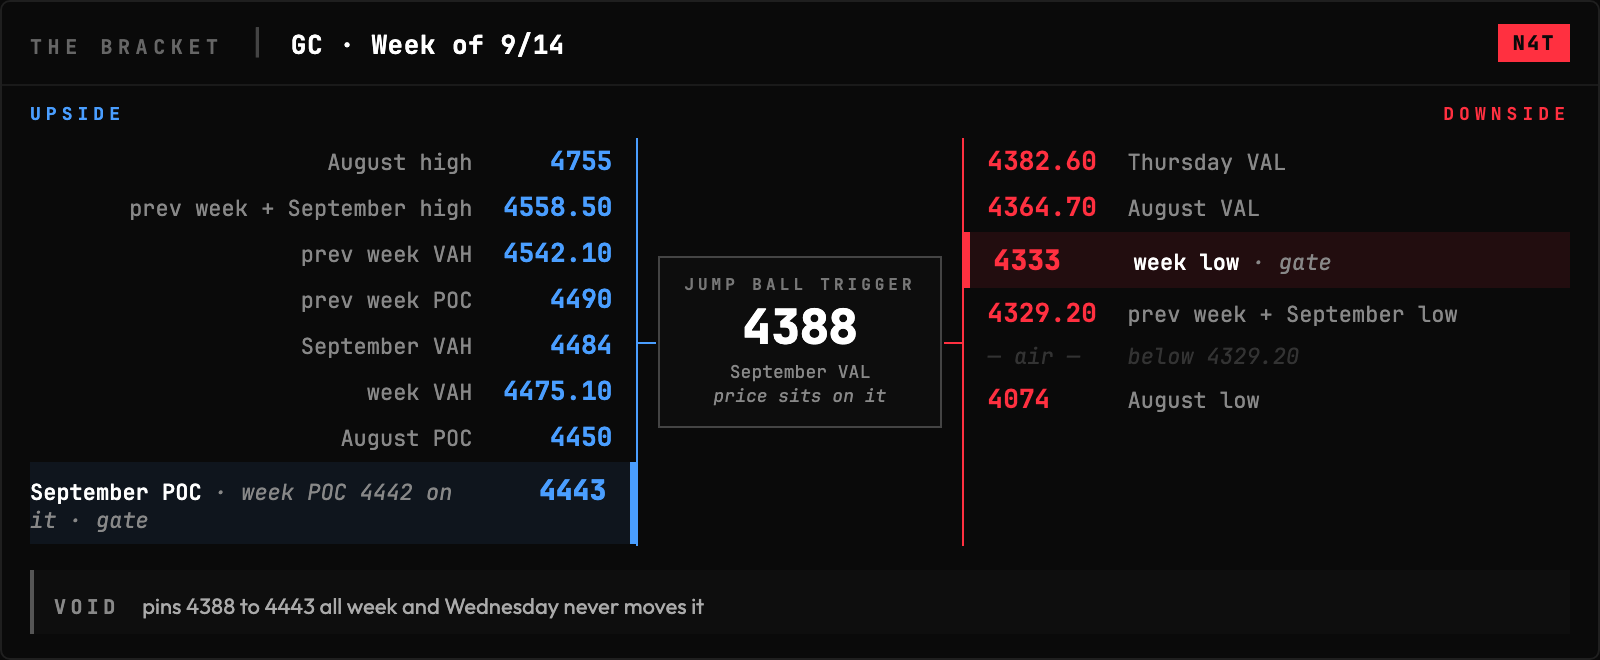
GC is 4390, under the 4405.10 floor of its own week and holding September’s 4388 with nothing to spare. Two straight lower weeks now, two straight closes under the value it built, and Friday’s 4333 print ran through the month’s value floor before the buyers took it back. The week’s POC is 4442, September’s is 4443, August’s is 4450, three timeframes stacking volume on one shelf that gold cannot get near.
Cross-asset read: Three of the four closed under the value their own week built. Crude closed on its. ES and GC are both under a value floor with a POC shelf overhead, and NQ is the only one that went to its month’s floor and got it back. Three charts asking permission and one that already has it.
Positioning (September 8 data): The S&P crowd went into the week net short better than eighty thousand contracts and spent it adding, close to three new shorts for every new long. The Nasdaq crowd is still net long and doing the same thing underneath, trimming longs and stacking shorts. The crude crowd carries roughly thirty-five thousand net longs into a market that already made the move, so nobody over there is early anymore.
Vol: VIX is 15.90 going into a rate decision and a September expiration in the same week. That is protection priced like the calendar is empty.
The Calendar
What I’m Watching This Week
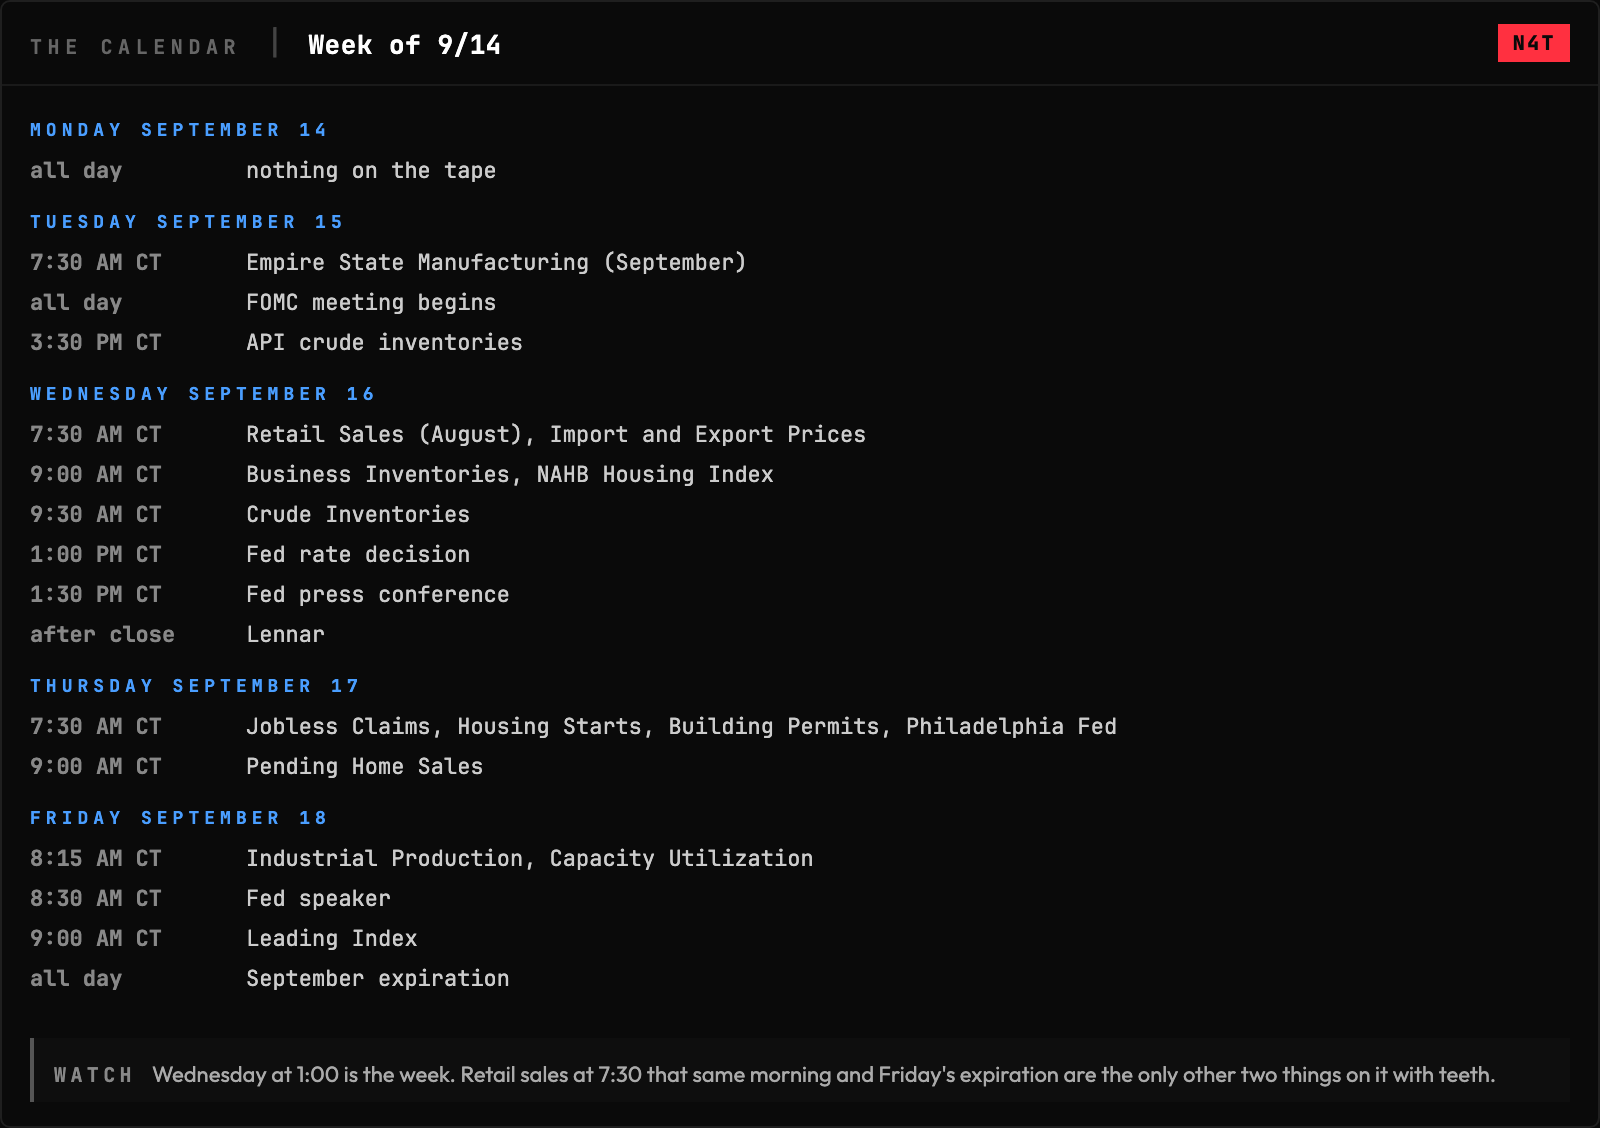
1. Wednesday at 1:00. One release can move all four charts and everything written above it stays conditional until it prints. The 7:30 retail number that same morning gets to set the mood first.
2. ES 7675.75 into 7679. The week’s value ceiling with September’s POC and last week’s POC sharing the number three points above it. Friday built its entire session underneath that shelf. Clearing it and holding is the difference between a repair and a lower high.
3. NQ 29040. September’s value floor, tested to the tick Friday morning and bought. It is the cleanest line on the board because nobody has to argue about where it is, and the obvious levels work precisely because everybody sees them.
4. Crude’s hundred. The week’s POC printed 100.05, Thursday’s printed 100.05, and the cap in the options book is 100. Three different things landing on one price is not a coincidence, that is where the market had its conversation.
5. Friday’s expiration. The S&P book carries better than two puts for every call into it while gold’s carries three and a half calls for every put. Two markets leaning opposite directions into the same bell, which is usually where I find a way to be wrong on both.
The Week’s Plan
ES:
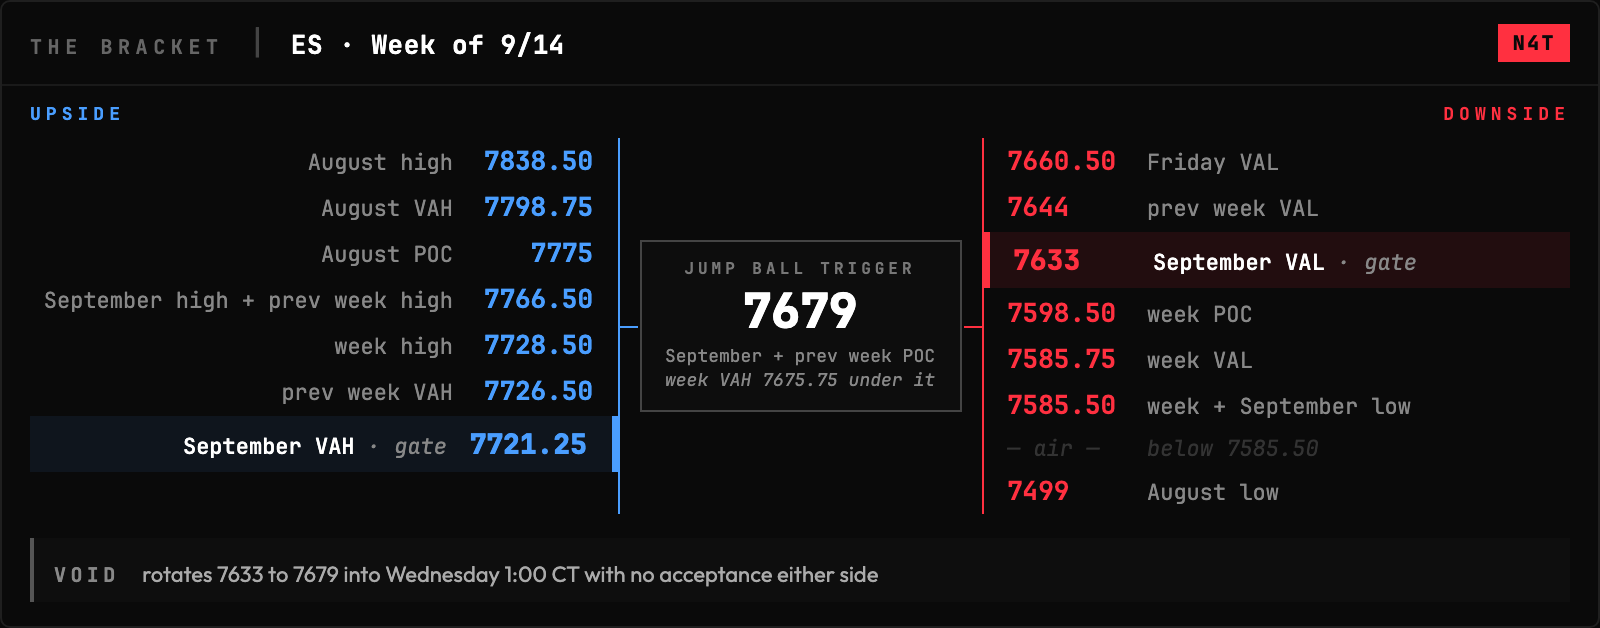
The shelf is 7675.75 into 7679, the week’s value ceiling with September and last week both leaving their POC on 7679 right above it, and ES trades 7660.75 underneath. Take that pair and hold it and the map runs 7721.25 September’s ceiling, 7726.50 last week’s, then 7728.50 the week’s high, with 7766.50 the September high and last week’s high sharing a number over them. What I do not have is evidence the buyers can do it, because the week built its whole POC at 7598.50 down near the low. Lose 7644, last week’s value floor, and 7633 is September’s right under it, and that is the number this month’s read hangs on. Below it the 7585.75 value floor sits on the 7585.50 week low, and under that shelf there is nothing until 7499, the low August left.
NQ:
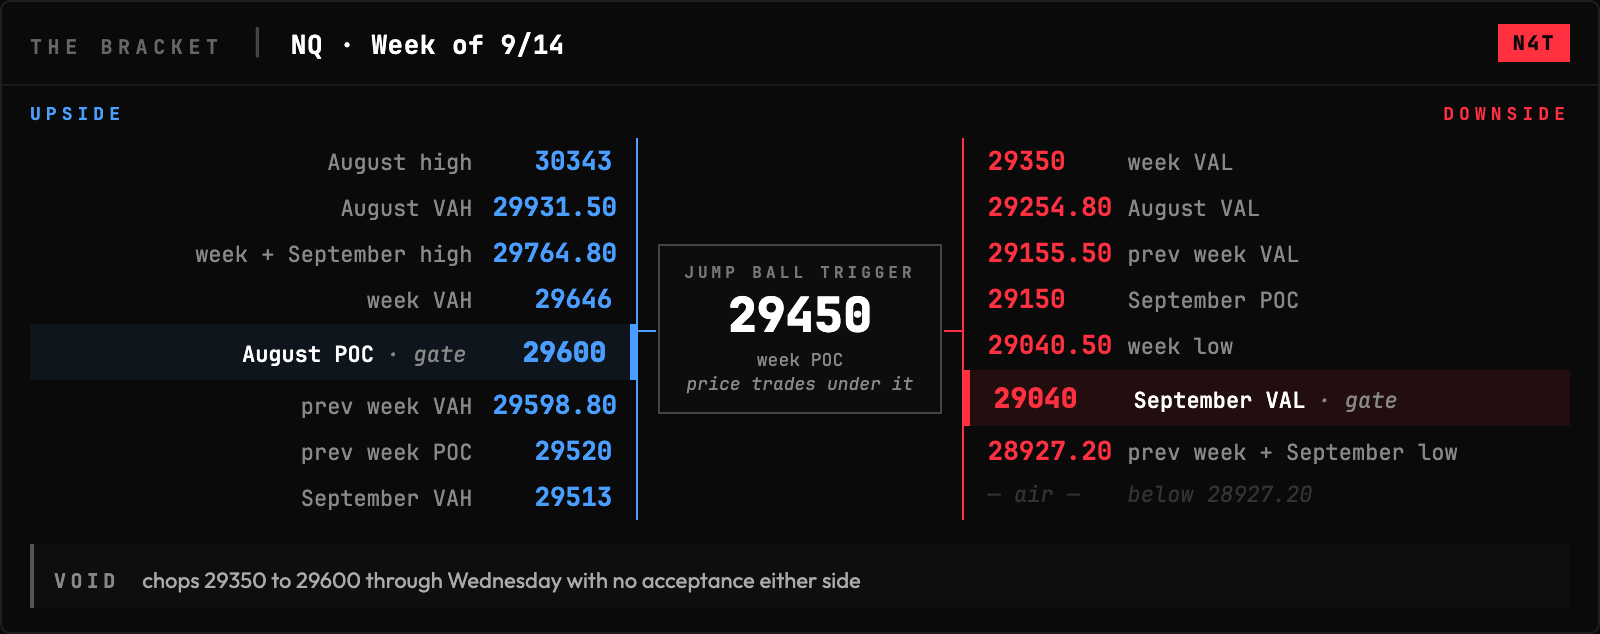
NQ trades 29391.75 and the line is 29450, the print the week actually built its volume on, with September’s 29513 ceiling behind it. Clear those and 29520 last week’s POC comes first, then the 29598.80 to 29600 shelf where last week’s value topped and August left its volume. That is one price doing two jobs and it caps everything until somebody closes over it. Reclaiming 29450 is the easy half, because what NQ really did this week was go to 29040, September’s value floor, and buy it to the tick, so the bears have to take that low out before anything underneath counts. Lose 29350 and the week’s own floor is gone, then 29254.80 August’s catches, then 29155.50 last week’s on 29150 September’s POC, and under 29040 the profile goes quiet to 28927.20.
CL:
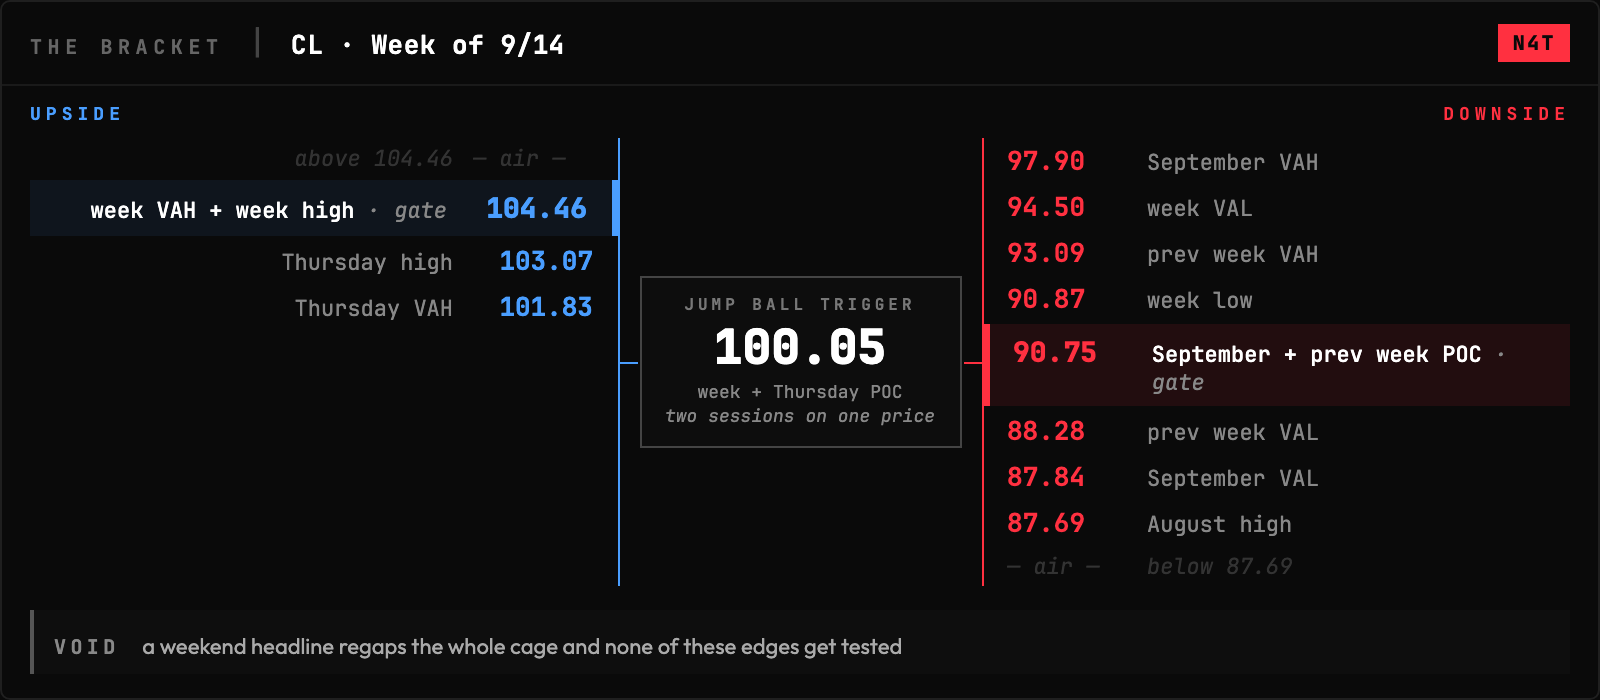
Crude trades 99.99 and the whole decision is the hundred, because the week’s POC and Thursday’s POC both printed 100.05 and the options cap is 100. Hold that shelf and there is nothing overhead but 101.83 Thursday’s value ceiling and 103.07 its high, then 104.46 where the week’s value ceiling and the week’s high printed together. Fail it and the vacuum is real, because the next volume shelf is all the way down at 94.50 and the profile built nothing in between. Under 94.50 the 93.09 prior week ceiling catches, then the 90.87 week low on 90.75 where September and last week both left their POC. Below that pair 88.28 is last week’s value floor, 87.84 is September’s, and 87.69 is the August high this entire move launched from.
GC:
Gold trades 4390, under the 4405.10 floor of its own week and on top of September’s 4388, and that 4388 is the gate. Hold it and the work starts back at 4405.10, then the 4442, 4443, 4450 stack where the week, September and August all left their volume. That stack decides whether two lower weeks were a pullback or a turn. What argues against it is two straight closes under the value it built, which means sellers own every price from 4405.10 up to 4490 and somebody has to eat through all of them. Lose 4388 and 4382.60 Thursday’s value floor catches, then 4364.70 August’s, then the 4333 week low with 4329.20 September’s low under it.
The White Van Stuff
Every index book expiring between now and Friday is built to push a move along instead of soaking it up, so whatever Wednesday does gets a tailwind it would not normally get. The S&P’s Friday book runs better than two puts for every call and it is the heaviest one on the board. Gold’s Friday book is the mirror image at three and a half calls for every put.
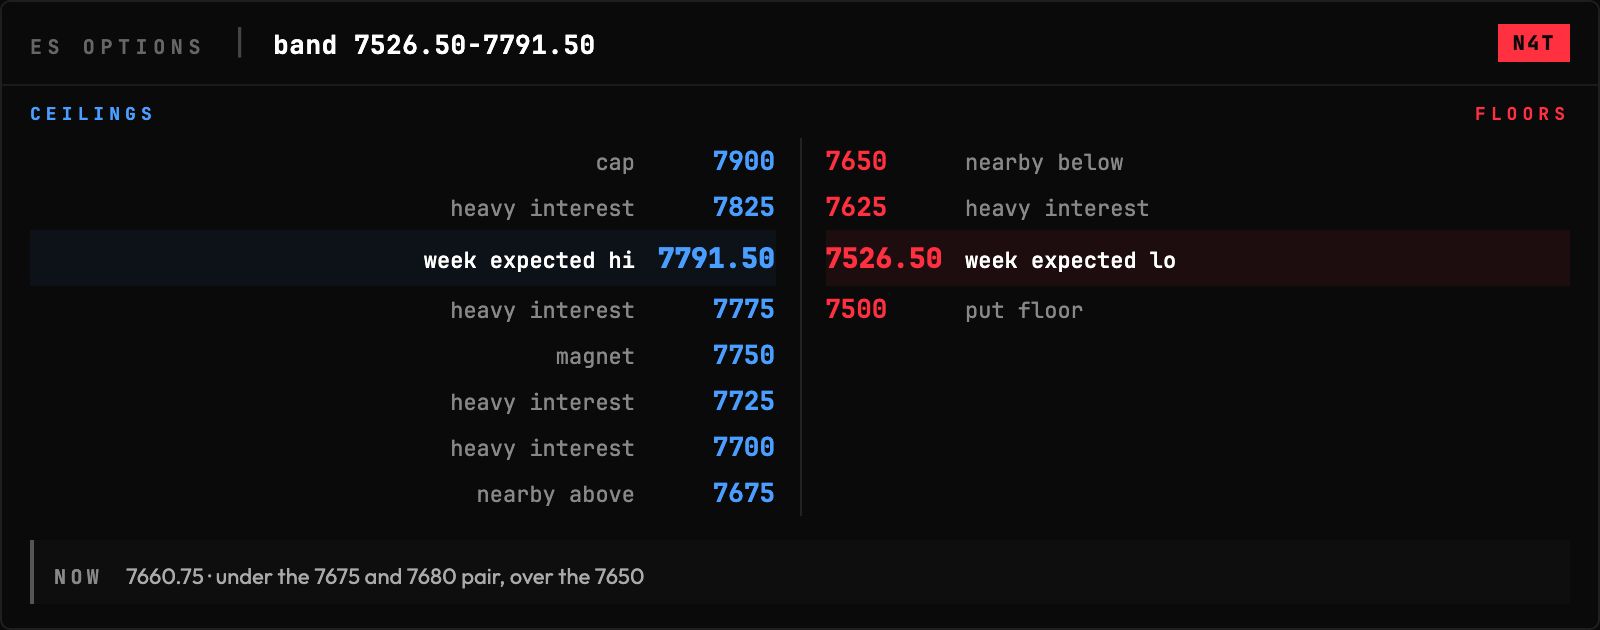
ES: The heaviest line in the S&P book is 7700 and it sits above the 7675 and 7680 pair price is under, with the magnet up at 7750. Below price the book has 7650, then 7625, then a long walk down to the 7500 floor. The week band runs 7526.50 to 7791.50.
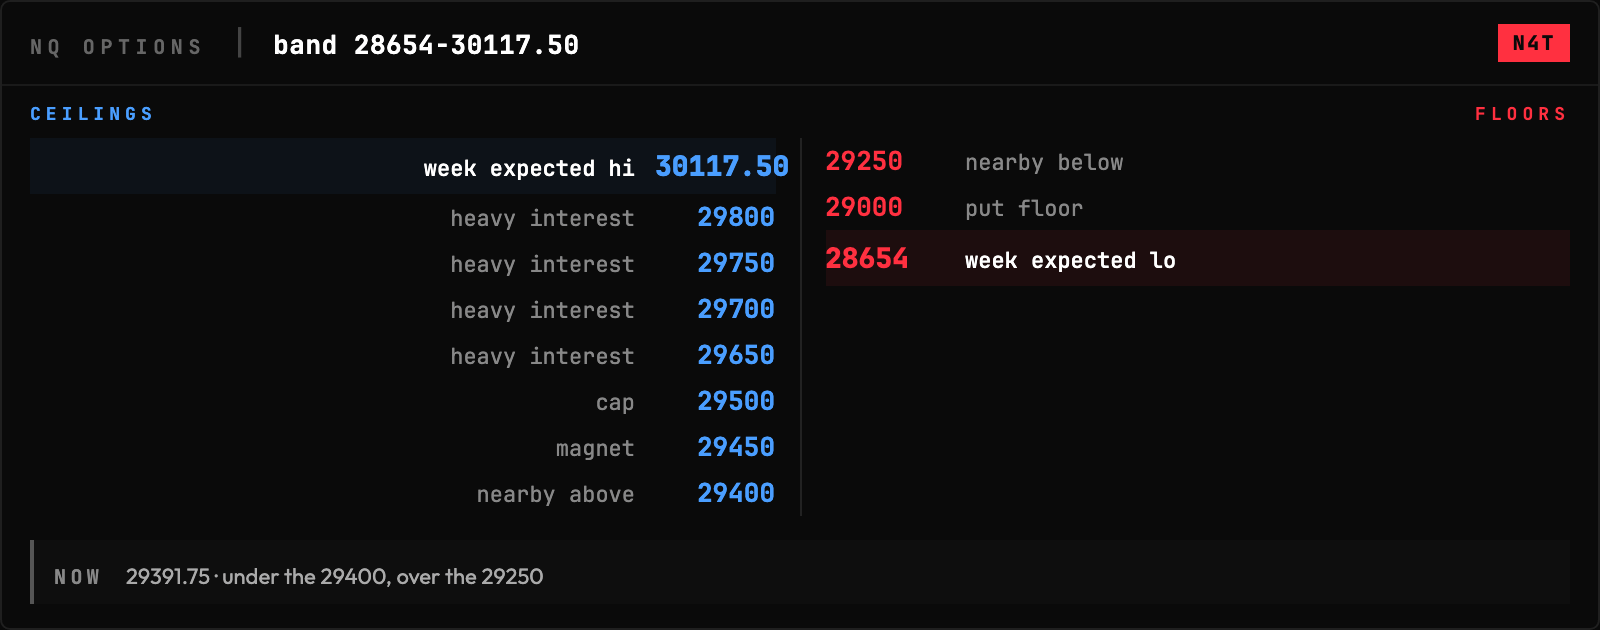
NQ: NQ sits a few points under 29400, the single heaviest line in its own book, with the 29450 magnet and the 29500 cap stacked right above it. Everything else the book owns is the 29650 through 29800 ladder or it is out at 30100 and higher. Under price there is 29250 and then the 29000 floor, with nothing in between.
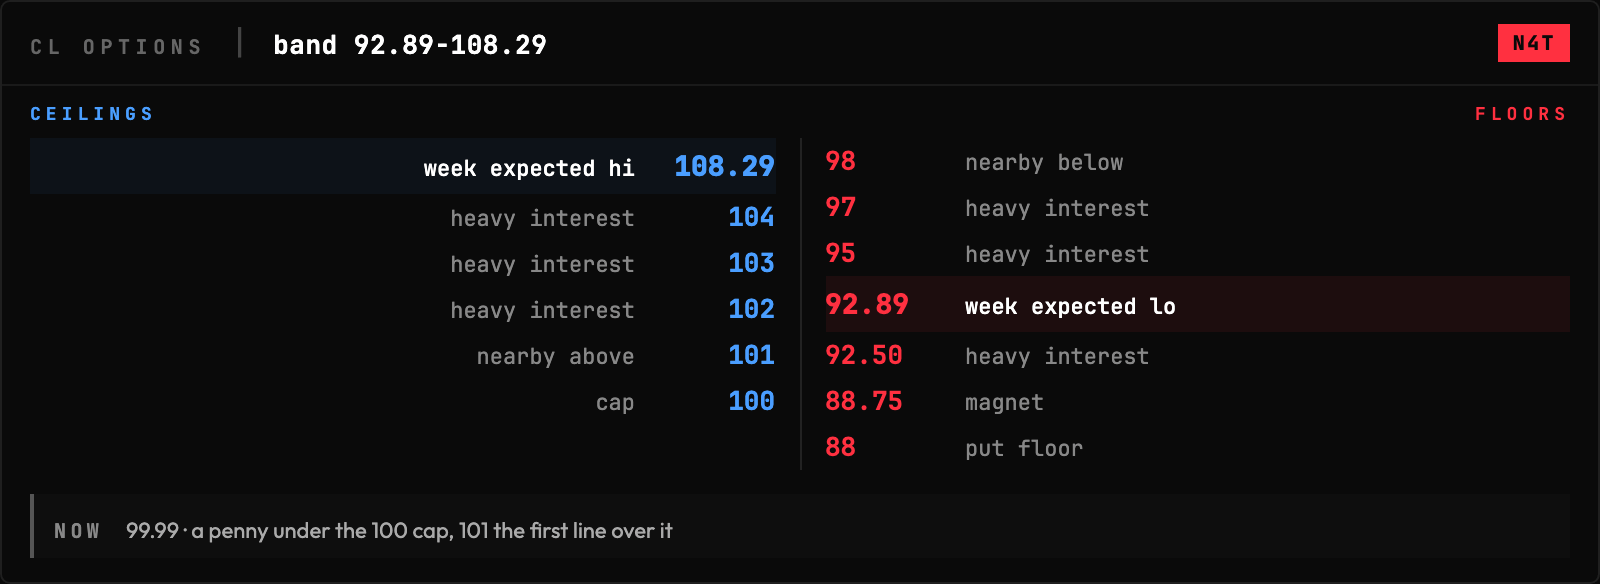
CL: Crude is sitting on its own cap. 100 is the structural line the book drew and price is a penny under it, with 101 through 104 the only interest overhead and the heaviest of that at 102. Everything else this book owns is underneath, a ladder from 98 down through 92.50 into the 88.75 magnet and the 88 floor.
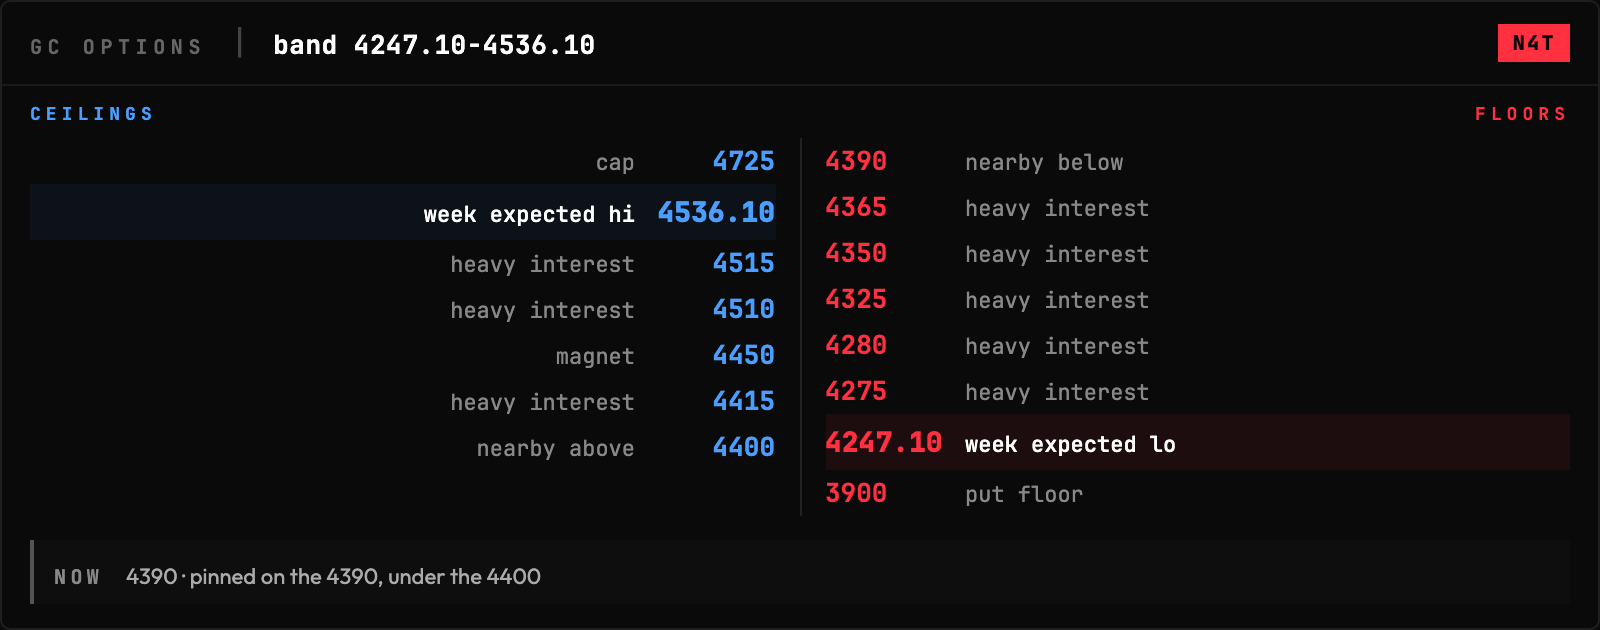
GC: Gold is wedged between the two heaviest lines in its book, 4400 over it and 4390 under it. Above that pair the book thins to 4415 and then the 4450 magnet, with 4510 and 4515 behind it and the cap a long way off at 4725. Under price it steps 4365, 4350, 4325 and then the 4280 and 4275 pair.
Fasten your seatbelts. It’s going to be a bumpy night.
If this brief is making you money, the best way to back me is to trade with Lucid Trading. Use my link or code VIBE.
I am not a financial advisor, CTA, or portfolio manager. Nothing here is a recommendation to buy, sell, or hold anything. Futures trading is not suitable for everyone. You can lose more than your initial investment. Only trade with money you can afford to lose. Past performance does not guarantee future results.
Free orderflow course: course.nick4atick.com | X: @Nick4ATick