

They hiked. The Fed did it, they actually showed some balls. First one in three years, unanimous, and 16 of the 18 of them have another one penciled in before the year is out. The tape spent three sessions treating that like news and then took every bit of it back Thursday and Friday, so the four charts I am looking at tonight sit about where they did when the meeting started. Protection got cheaper through all of it. The VIX went out at 14.81, which given all the shit going on in bond land…might be concerning. We’ll see if the markets give a shit. Opex came and went and we enter a window of weakness if you give a fuck at all about seasonality.

The Week That Was
The Fed raised its target range Wednesday to 3.75 to 4.00, the first increase since 2023, and 16 of 18 policymakers put at least one more on the board before December. Everything sold into it. ES printed 7575 Wednesday, NQ printed 29053, gold printed 4293. Then Thursday and Friday the whole board turned around at once as the long end backed away from 5 percent and crude fell apart, which took the inflation argument off the table for a couple of days. The Nasdaq was the only major index green on the week while the Dow lost better than a percent and a half. Friday was September expiration on top of the whole thing.
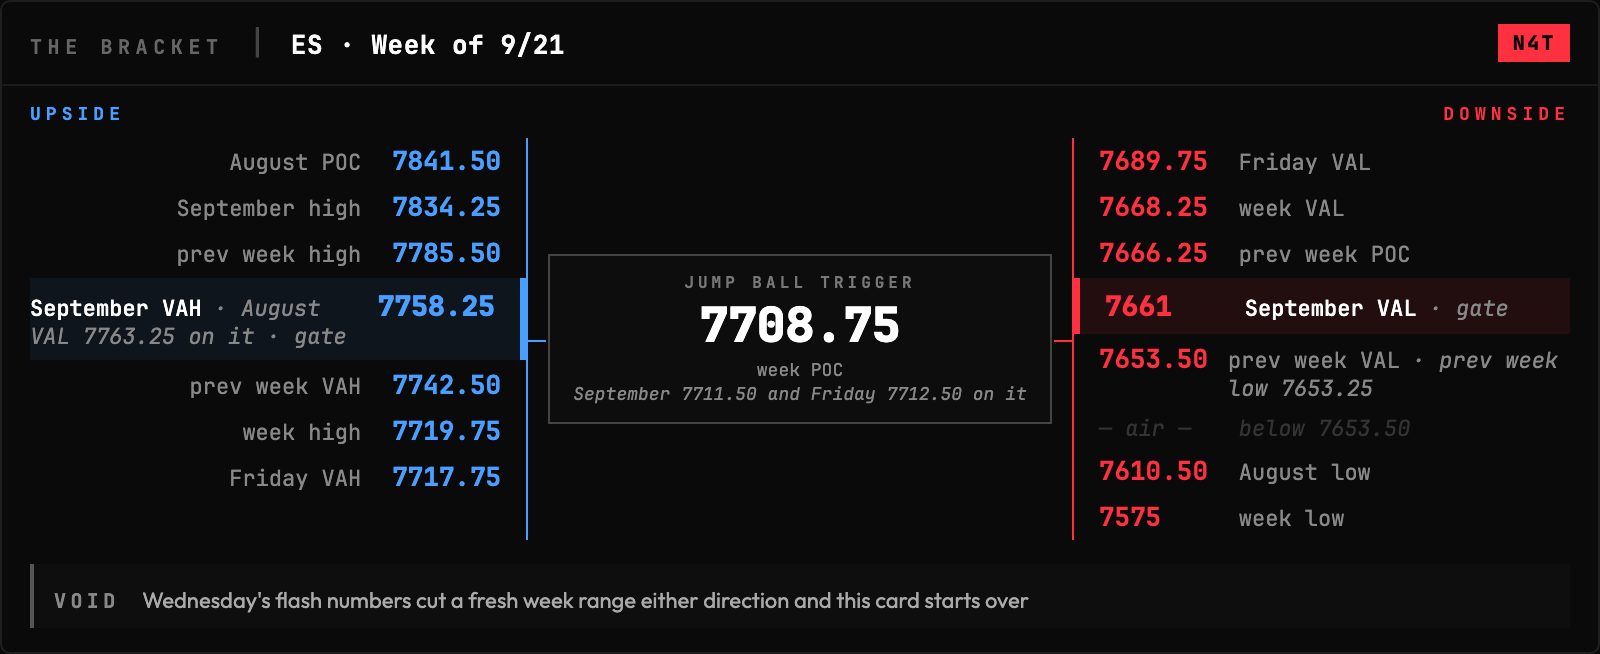
ES is 7712.50 with the week’s POC at 7708.75 and September’s at 7711.50 printed underneath it, three timeframes leaving their volume on one shelf. It traded 7575 Wednesday and went out Friday at the top of the week, so the hole filled in two sessions. What it has not done is take 7715, the ceiling its week built, and that number sits directly on top of the close.
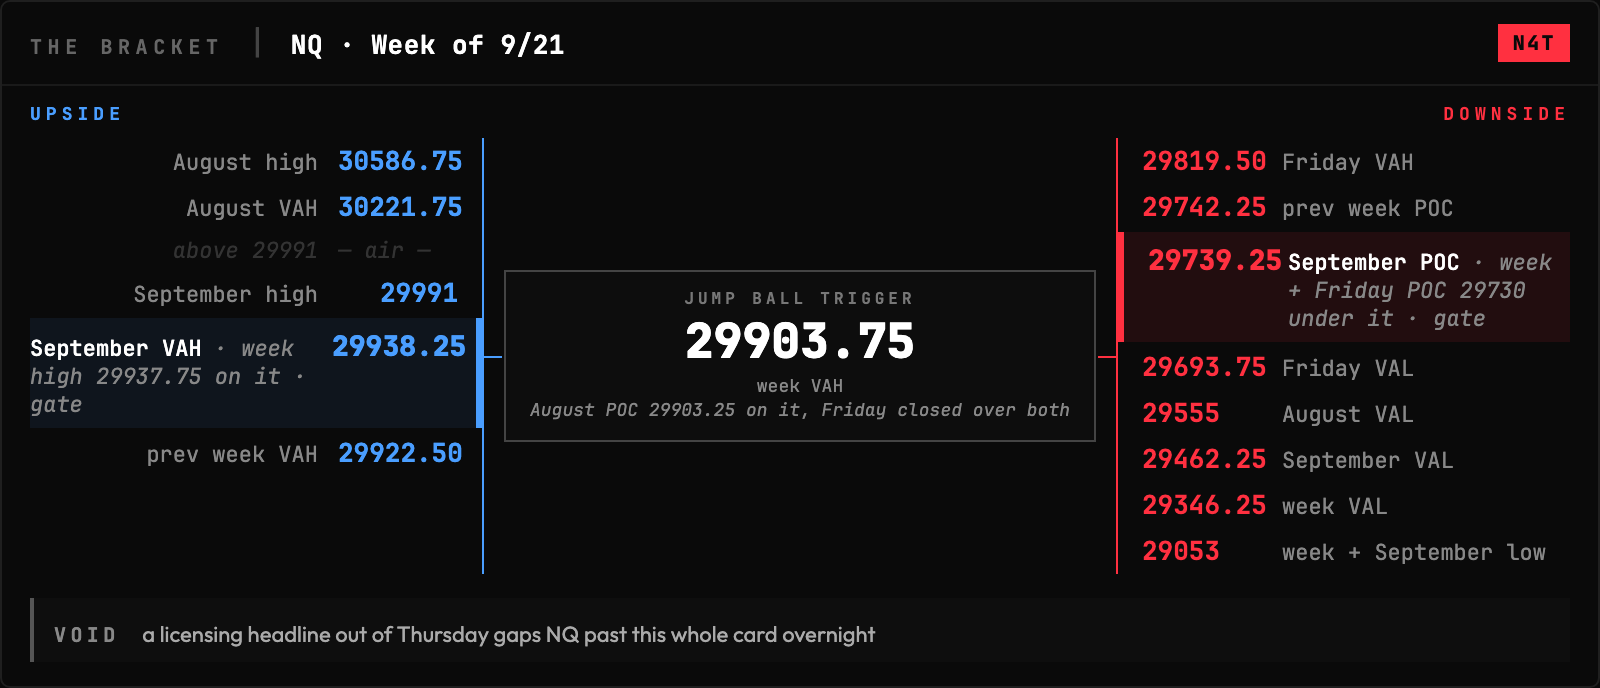
NQ is 29916.25 and it closed above every piece of value its week made, over the 29903.75 ceiling with August’s 29903.25 POC printed on the same shelf. Wednesday it took 29053, where the week low and September’s landed together, and bought it. Started the week in the hole, finished it at the week high, the only one of the four that can say that.
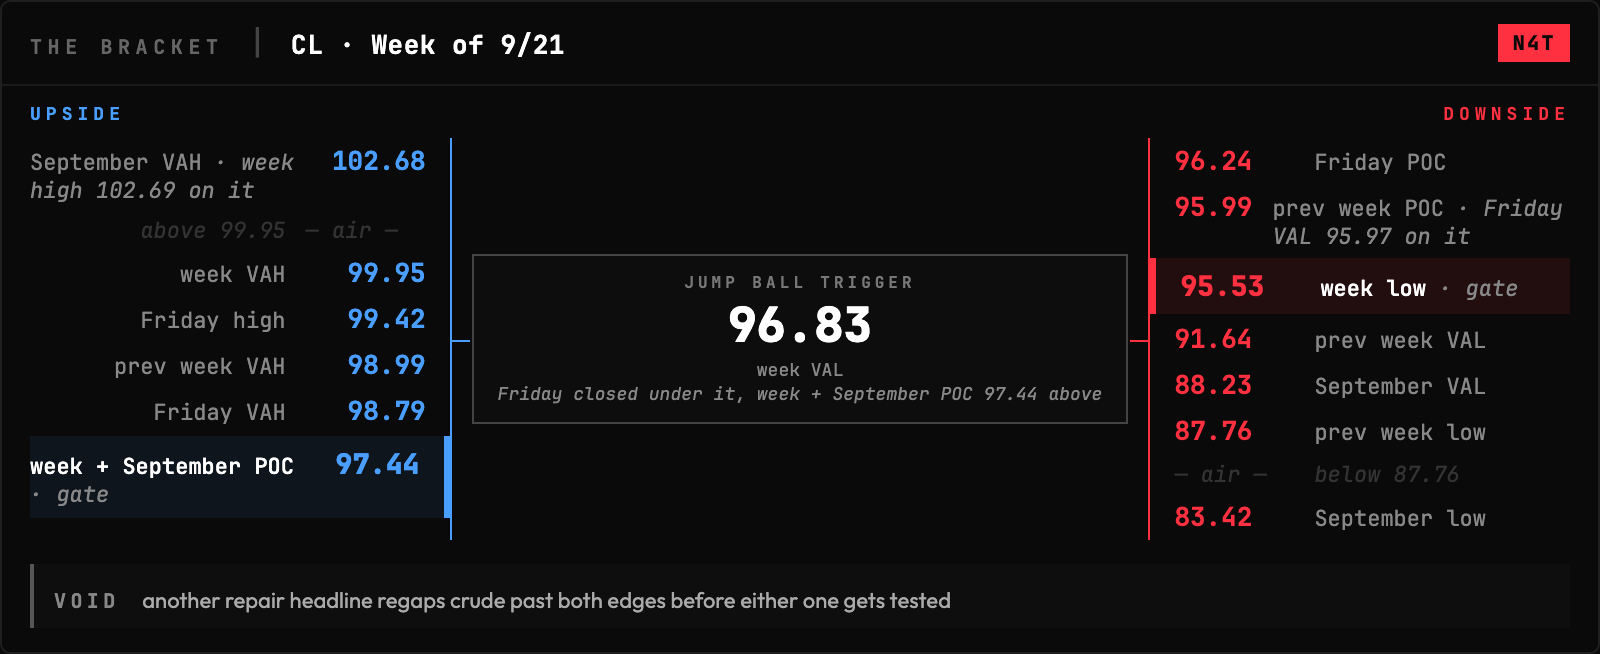
CL is 96.19 and it is the one chart that finished below the value it built, with 96.83 the floor it lost and 97.44 the POC the week and September both landed on. It opened at 100.15, ran 102.69, and handed the whole move back the moment the Saudi repair headlines started landing. September’s value area on this thing runs from 88.23 all the way up to 102.68, which is not a market that has agreed on anything yet. It goes into tonight standing on the shelf Friday built, 96.24 the session POC with last week’s 95.99 right under it.
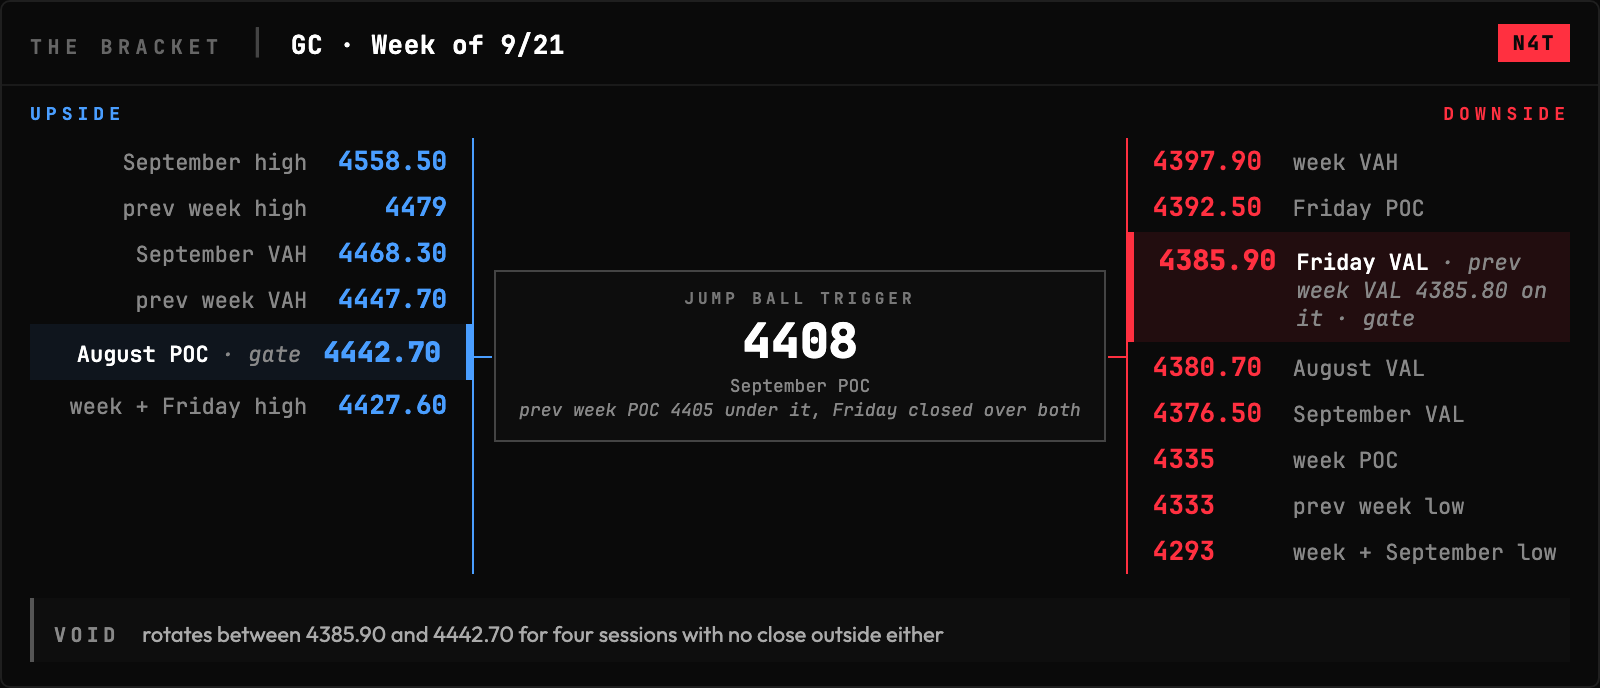
GC is 4425.30, back over the 4408 and 4405 pair where September and last week both left their POC, after spending Monday through Wednesday underneath the pair. The week put its volume way down at 4335 and printed 4293, September’s low to the tick, before Thursday and Friday took the whole range back. That ends two straight lower weeks on a session that closed at the high.
Cross-asset read: Three of the four closed on or above the volume their own week built and crude is the one sitting underneath it. NQ and GC both went to their September lows midweek and finished at their week highs, which is the same trade twice on two charts that usually argue with each other. Crude went the other direction and gave back the premium both of them were reacting to.
Positioning (September 15 data): The S&P crowd walked into the meeting net short better than 83,000 contracts, trimming both sides but cutting longs harder, leaning against this tape for another week. The Nasdaq crowd did the opposite and covered close to 14,000 shorts to sit net long into it. Every one of those numbers is Tuesday’s, which means none of it has the decision in it yet.
Vol: VIX closed 14.81, lower on the week. Rates went up for the first time since 2023 and protection got cheaper, which tells you exactly how seriously the option market is taking the second one.
The Calendar
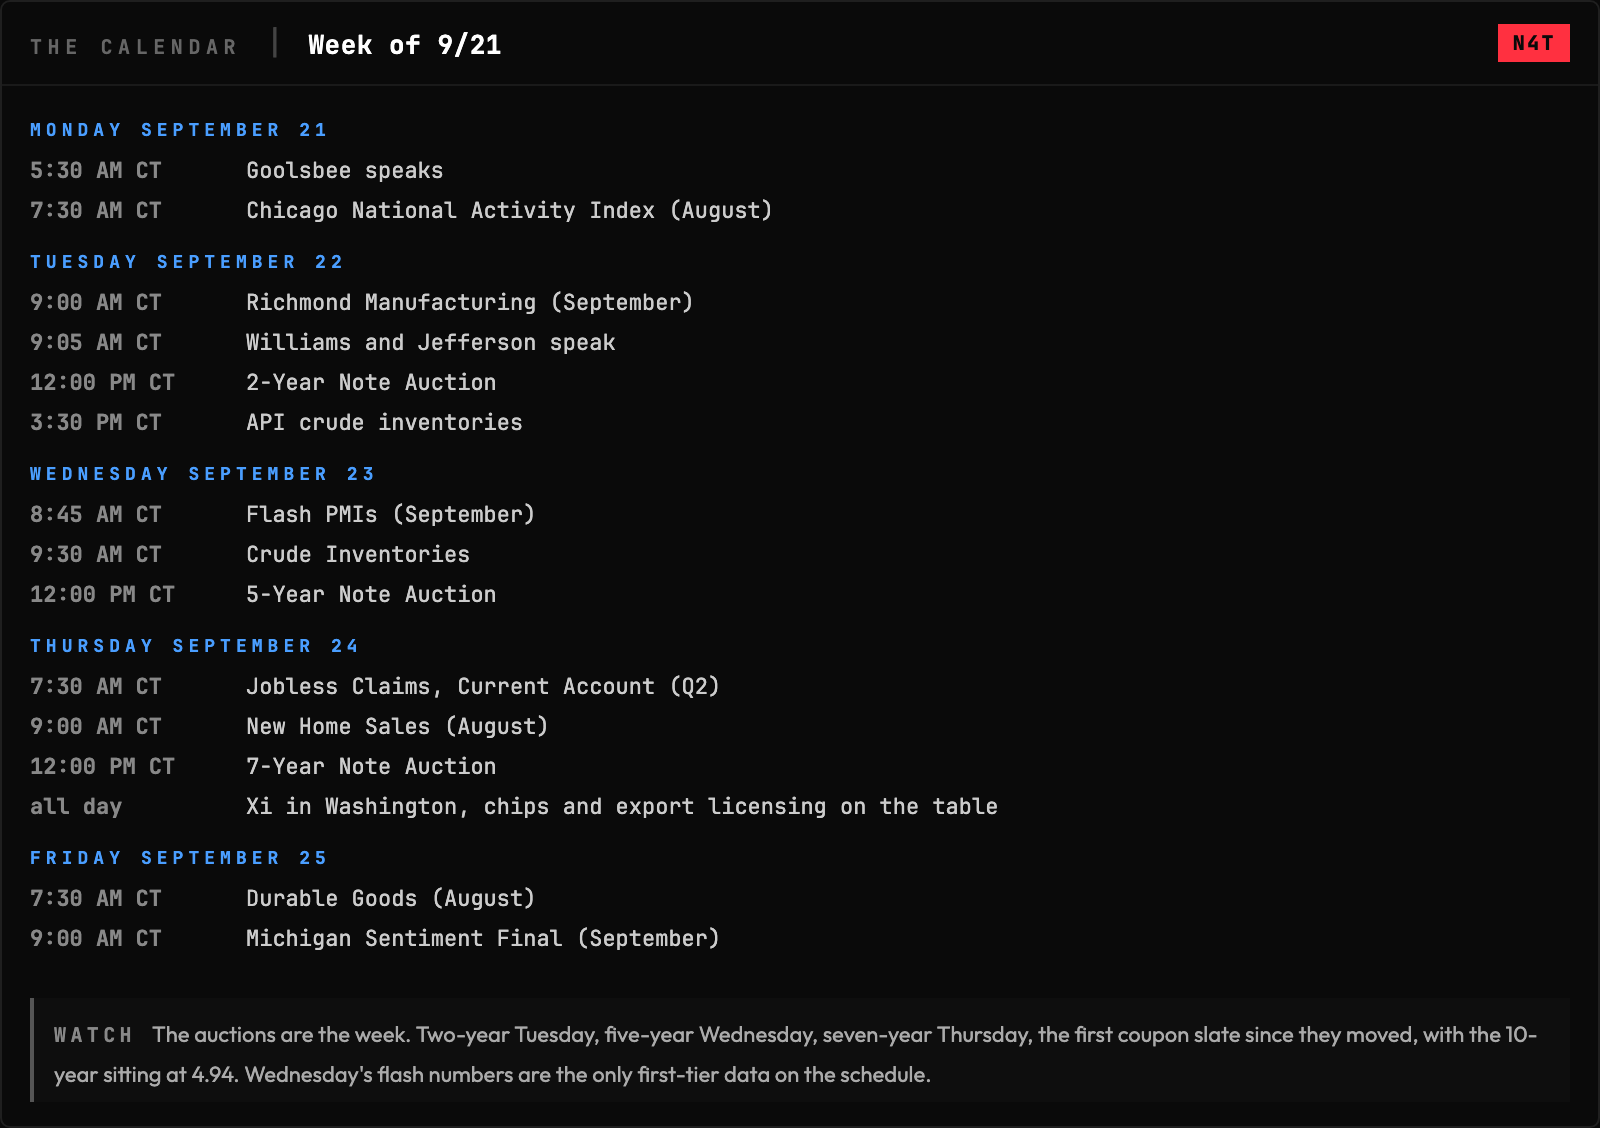
Nine speakers in five days and no inflation print to argue with them. The information this week comes out of the auctions and out of Thursday.
What I’m Watching This Week
1. The coupon slate. Two-year Tuesday, five-year Wednesday, seven-year Thursday, the first real test of demand since the target range moved. The 10-year is 4.94 and a bad takedown puts 5 percent back on the screen, which reprices every chart in this brief off one number.
2. ES 7708.75 into 7715. The week’s POC with September’s 7711.50 and Friday’s 7712.50 stacked on it and 7715, the ceiling the week put on its value, right over the top of all three. Price closed inside that shelf. Everything above it is repair and everything under it is Wednesday again.
3. NQ 29903. Where the week topped its value with August’s POC printed alongside it, and Friday closed above the pair. It is the one chart that already has permission, which also means it is the one with the most to lose Monday morning.
4. Crude’s 97.44. September and the week left their POC on that same price and Friday finished under it. Take it back and the flush was a shakeout inside the range. Fail it and 95.53 is the only thing standing between price and the 91.64 shelf.
5. Thursday in Washington. The whole conversation is chips and export licensing, and the semiconductor book is sitting at the 95th percentile of its own year while small caps sit at the 9th and the banks at the 20th. One headline gets to move the exact index everybody is already crowded into.
The Week’s Plan
ES:
ES closed at 7712.50 standing on 7708.75, the week’s POC, with September’s 7711.50 and Friday’s own 7712.50 printed on top of it. Three timeframes putting their volume on one shelf is not a coincidence, that is where the market had its conversation about a rate hike and decided the answer was nothing. What it has not done is take 7715, the top of the week’s own value, with 7717.75 Friday’s ceiling and 7719.75 the week high right behind it. Clear that stack and 7742.50, where last week capped its value, is the first real work. Behind it is 7758.25 September’s ceiling with August’s 7763.25 floor printed on it, the pair that decides whether this month is a pullback or a lower high. Above those it reads 7785.50 last week’s high and 7834.25 September’s, with 7841.50 August’s POC where the summer put its actual volume. Lose 7708.75 and 7689.75 where Friday bottomed its value catches, then the 7668.25 and 7666.25 pair where its week floor landed on last week’s POC, and 7661 September’s value floor is the gate beneath the stack. Below 7653.50, where last week’s value floor and last week’s low print together, the chart goes quiet until 7610.50 August’s low and 7575 the week’s.
NQ:
NQ is the only one of the four that closed above everything its week built, going out 29916.25 over the 29903.75 ceiling with August’s 29903.25 POC sitting on the same shelf. What makes that shelf worth anything is Wednesday, when it printed 29053, where the week low and September’s landed together, and bought it. Above price the work is 29922.50 where last week’s value topped, then 29938.25 September’s with the 29937.75 week high riding it, and 29991 September’s high behind the pair. Take those and the map turns into August’s, 30221.75 the value ceiling and 30586.75 the high, with nothing structural in between. The argument against it is where the week actually did its business. September left its POC at 29739.25, last week left its at 29742.25, and the week and Friday both printed 29730. Four timeframes saying the real volume sits a long way under Friday’s close. Lose 29903 and that four POC shelf is the destination, then 29693.75 the floor Friday drew, 29555 August’s, and 29462.25 September’s. Under 29346.25, the floor the week drew, it is 29053 or nothing.
CL:
Crude closed 96.19, under 96.83, the bottom of the week’s value, and under the 97.44 POC the week and September both printed, and that pair is the whole plan. It opened 100.15, ran 102.69, and gave every bit of it back once the pipeline repair started showing up in headlines, so everything overhead is work crude has to earn a second time. The honest problem with any of it is that September’s value runs 88.23 to 102.68 on this contract, so being inside value here tells you almost nothing about what happens next. Reclaim 96.83 and 97.44 and 98.79 Friday’s ceiling comes next, then 98.99 last week’s and 99.42 Friday’s high, with 99.95 the ceiling the week built capping the whole repair. Past 99.95 there is nothing until 102.68, where September topped its value on the 102.69 high. Underneath, price is sitting on a shelf it built itself Friday. That is 96.24 the session POC with last week’s 95.99 and Friday’s 95.97 value floor stacked right under it, and 95.53 the week low is the gate beneath the pile. Lose 95.53 and the profile is empty down to 91.64 where last week’s value bottomed, then 88.23 September’s floor and 87.76 the low last week made.
GC:
Gold went out 4425.30, back over the 4408 and 4405 pair where September and last week both left their POC, and that pair is the line this whole read hangs on. It spent Monday through Wednesday below both and printed 4293, September’s low to the tick, before Thursday and Friday took the entire week back. Hold 4408 and the next job is 4427.60, the high Friday and the week share, then 4442.70 August’s POC, the shelf that decides whether two lower weeks were the pullback or the start of something. Over that it reads 4447.70 last week’s ceiling, 4468.30 September’s, 4479 last week’s high, and 4558.50 the high September made. What I do not have is a single session of real business up here, because the week printed its volume down at 4335 and price closed nowhere near it. Lose 4408 and 4397.90 the ceiling the week drew catches, then 4392.50 Friday’s POC. Under those is the 4385.90 and 4385.80 pair where Friday’s value bottom and last week’s landed on one number, with 4380.70 August’s floor and 4376.50 September’s beneath it.
The White Van Stuff
The September book cleared out Friday and what rebuilt underneath it leans the wrong way for anybody hoping the quiet holds. The S&P’s Friday expiration carries better than two puts for every call and the tech book runs closer to two and a half, both of them shaped to push a move along instead of soak it up. Underneath that the weight is stacked in one place: the semiconductor book sits at the 95th percentile of its own year with the megacap names right behind it, while small caps sit at the 9th and the banks at the 20th.
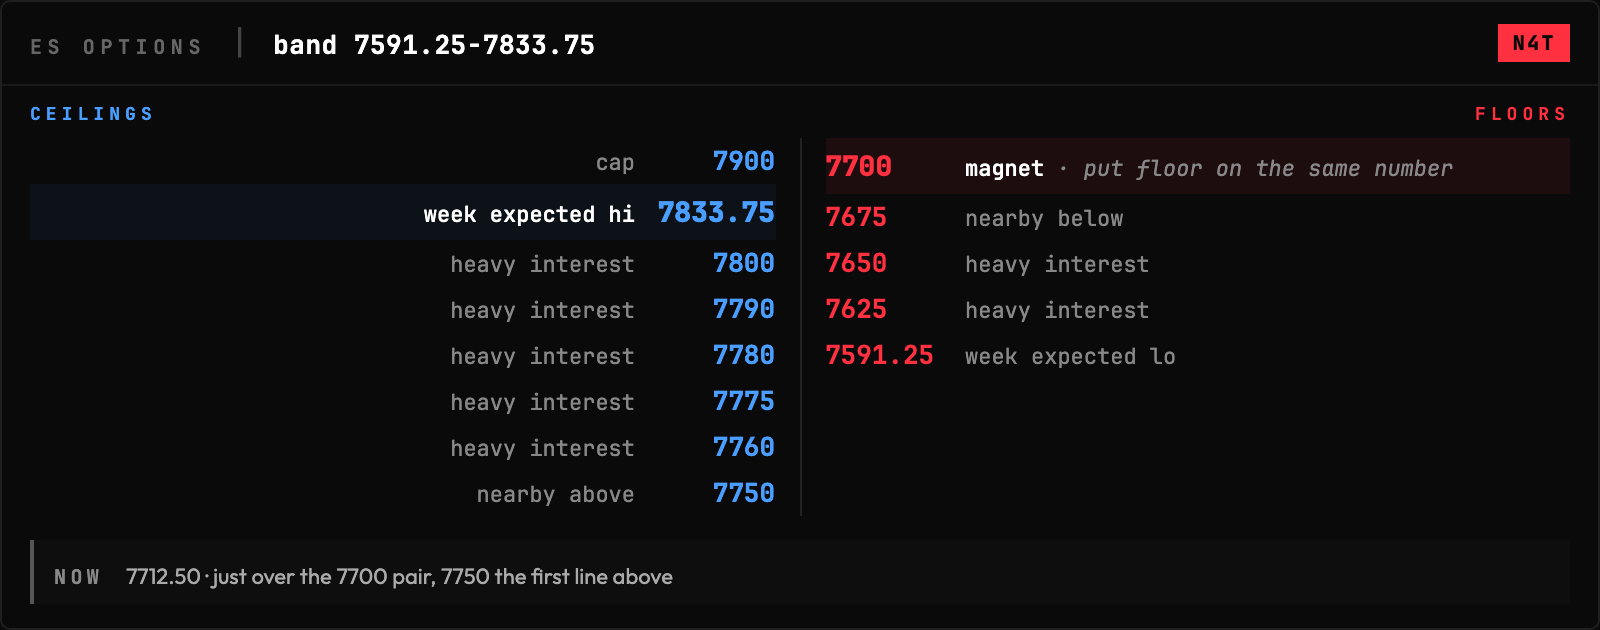
ES: The magnet and the put floor are the same number on ES, 7700, and price closed just over the pair. Everything the book owns above is the 7750 through 7800 ladder into the 7900 cap, and under 7700 there is 7675 and then a walk down to 7625. The week band runs 7591.25 to 7833.75.
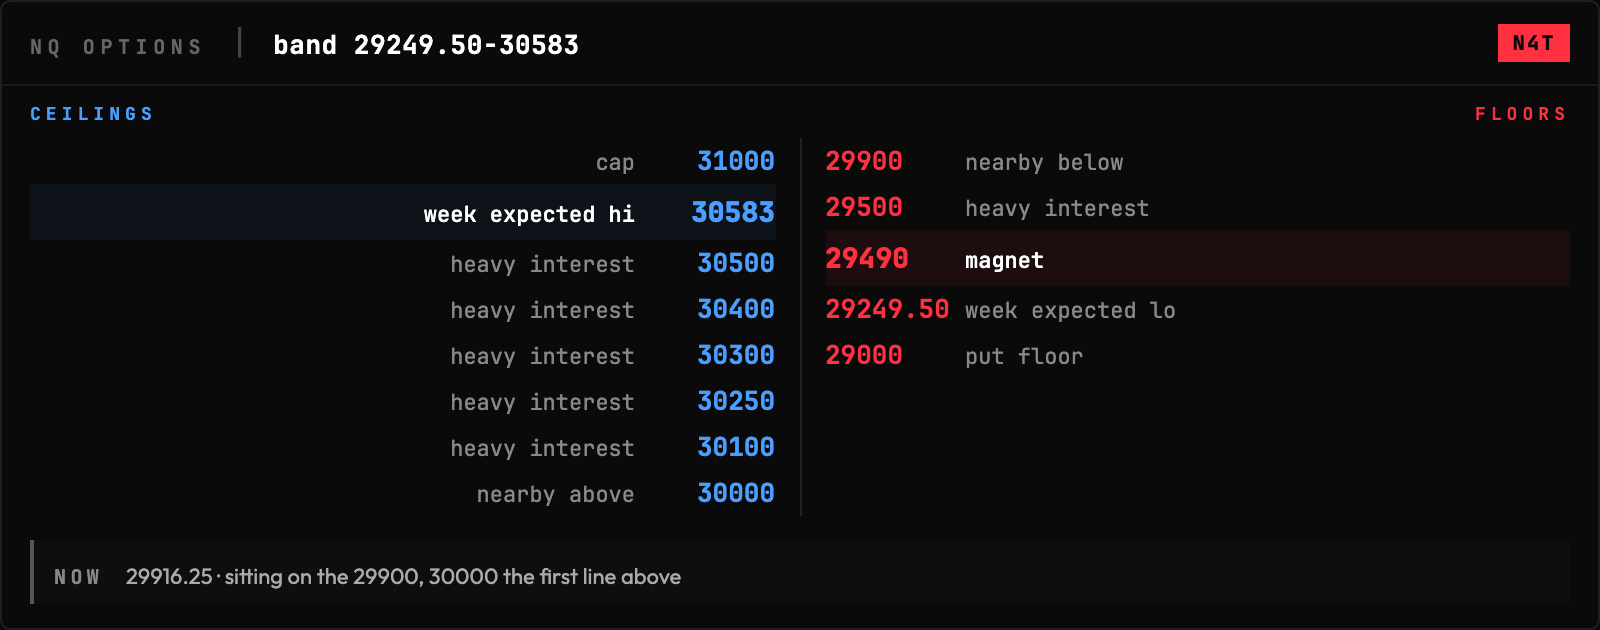
NQ: NQ closed on the single highest line its book has underneath it, 29900, with everything else it owns stacked overhead from 30000 up through 30500 and the cap out at 31000. Below that one line the next thing carrying weight is the 29490 magnet. The band runs 29249.50 to 30583.
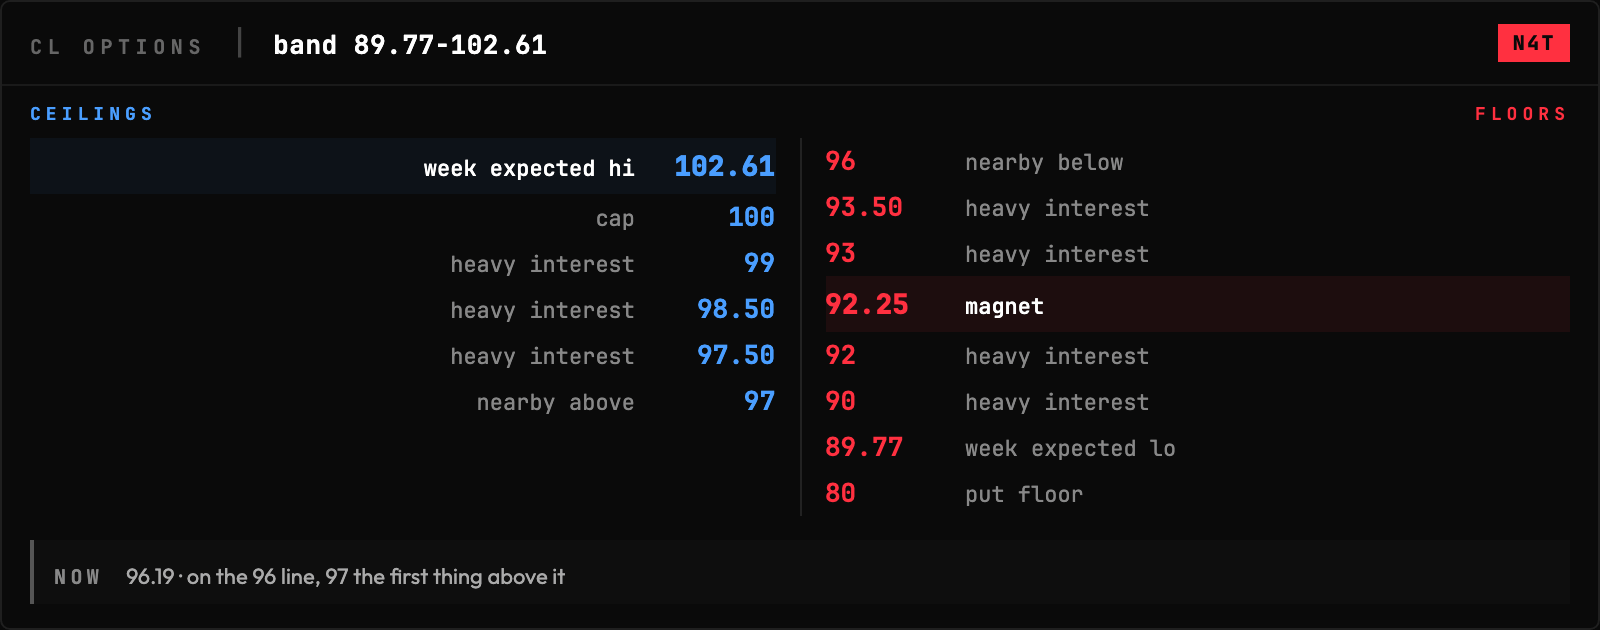
CL: Crude’s book is upside down against the tape, with the 100 cap the only real line overhead and the entire ladder from 93.50 down through 90 sitting under price. It closed on the 96 line, the second heaviest number in the book, and the magnet is down at 92.25.
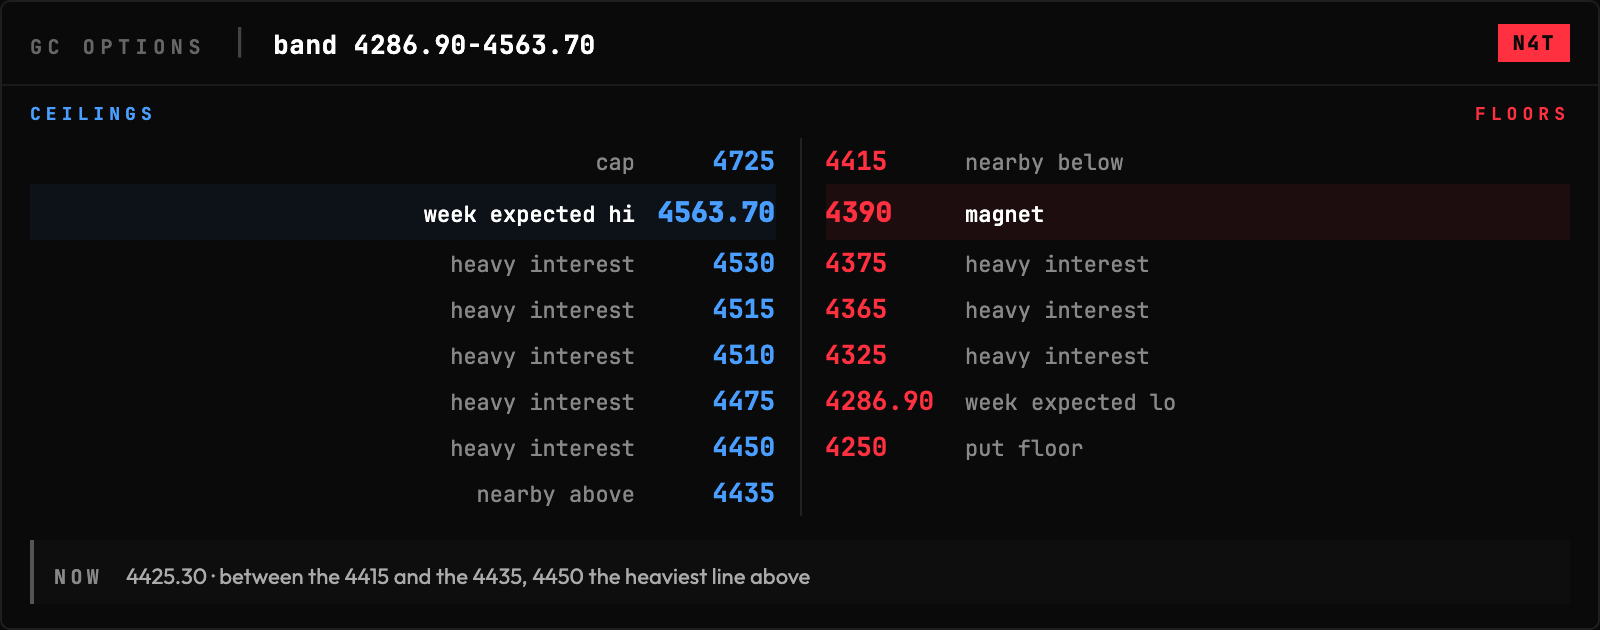
GC: Gold’s heaviest line is 4450 and it sits right above Friday’s close, with 4435 printed under it and the two of them wrapping the settle. Under price the book steps 4415, the 4390 magnet, then 4375 and 4365. The 4725 cap has not been relevant since August.
I will not get bear amnesia this week. I will not get bear amnesia this week.

If this brief is making you money, the best way to back me is to trade with Lucid Trading. Use my link or code VIBE.
I am not a financial advisor, CTA, or portfolio manager. Nothing here is a recommendation to buy, sell, or hold anything. Futures trading is not suitable for everyone. You can lose more than your initial investment. Only trade with money you can afford to lose. Past performance does not guarantee future results.
Free orderflow course: course.nick4atick.com | X: @Nick4ATick