


Happy quarter-end week. The 10-year printed 5.23 Friday morning, the highest it’s been since 2007, and the Nasdaq closed the week at the top of its range anyway. I’ve stopped trying to make that make sense. Crude went 89 to 97 and back to 92 in four sessions, gold sold every day into Thursday, and the S&P got its first up week in three with the VIX going out under 15. Two of my four charts closed above the volume their week built and the other two closed sitting right on it. Payrolls Friday. Keep it light and tight.

The Week That Was
The 10-year touched 5.23 Friday and settled 5.18, and the 30-year went out over five and a half. The S&P still put up its first winning week in three with the Nasdaq leading, and the Dow finally snapped a three week losing streak. The AI names did the lifting again, Microsoft ripped Friday on a software announcement, and Xi came and went from Washington with chip export controls left off the table entirely. Crude sold to 89.47 Tuesday when Saudi Arabia got its East-West pipeline pumping again, then ran to 96.78 Thursday on a rumor the White House wants a ninety day diesel export ban. It gave all of it back Friday when word got out that US and Iranian negotiators are working on a phased deal to reopen Hormuz and lift the port blockade. Gold sold four straight sessions with the dollar at a two month high and the odds of another hike in October moving from a coin flip to seventy percent. Wednesday morning’s inflation number and Friday’s payrolls are the two prints that set that number before the next meeting.
ES is 7804.50, sitting on Friday’s 7803.50 POC, in the upper half of the week’s value and above the 7787.25 ceiling September’s value built. The week gapped over everything last week did and ran 7848.50 Tuesday. Wednesday and Thursday it fell back to the 7708.75 to 7715 shelf where last week and September both left their POC, and Thursday’s overnight went to 7707.25, kissed it and turned. Buyers took the whole thing back in one Friday session. A week that gaps up, gets sold for two days and closes near the top is a week where the dip buyers are still running it. The number they bought is the number I’ve got the whole month hanging on.
NQ is 30891.50, over every price August built and over September’s 30467.25 value ceiling, sitting on Friday’s 30912 POC under the 30950 ceiling the week put on itself. It gapped from 29916.25 to 30222 on Monday’s open and never went back, then printed 31065.50 Wednesday for fresh highs. The two session hit that followed bottomed at 30370 in Thursday’s overnight and got bought right back into Friday’s close. The Monday gap at 30216.50 is still open. Every dip this week held above it, which makes this either the strongest chart on the board or the most crowded one, and I think the positioning data below says both.
CL is 92.24, sitting on 92.00, where the week’s POC and September’s POC print on the same price with Friday’s 92.20 POC stacked over them. It opened the week 93.70, sold to 89.47 Tuesday, ran 96.78 Thursday and finished right back where it started. All of that happened under the entire range last week traded. Three timeframes leaving their volume on one number after a week like that means the auction agreed on 92 and disagreed on everything else.
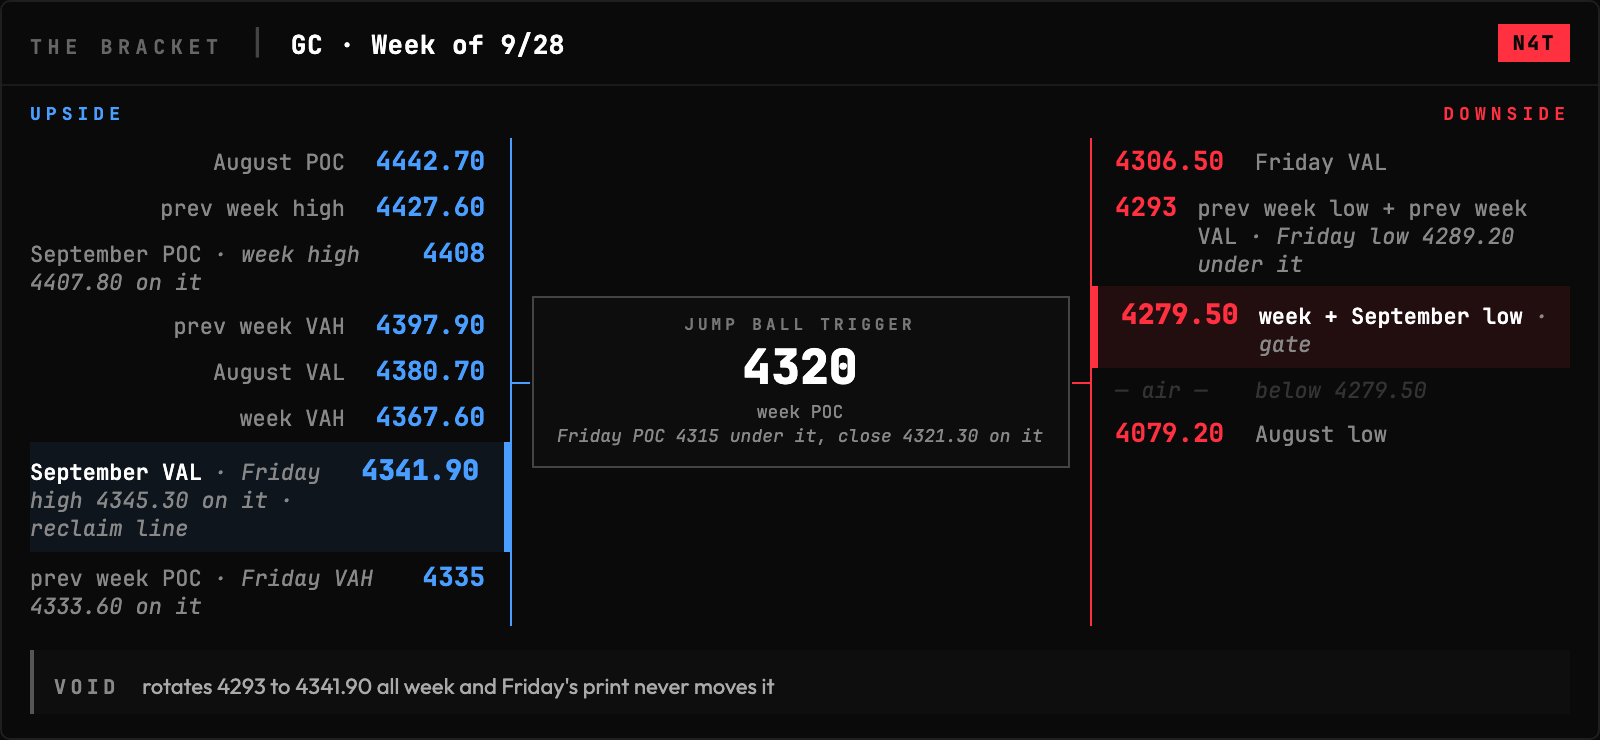
GC is 4321.30, on the week’s 4320 POC and under September’s 4341.90 value floor, after selling four straight sessions from 4405.60. Thursday printed 4279.50, a new low for the month under last week’s 4293, and Friday bought it back to the POC and stopped. Third down week in four, and it gave back the whole reclaim it made last Friday in one Monday session.
Cross-asset read: The indexes closed above the volume their week built and the commodities closed sitting exactly on theirs. ES and NQ went to their shelves Thursday and bought them, crude and gold went to new lows for the month and only got back to their POCs. Same rates, same dollar, opposite results, and I don’t have a clean story for why.
Positioning (September 22 data): The S&P crowd went from net short 83,000 to net short better than 112,000 in a week the index gapped up and held. They dumped close to 25,000 longs and added shorts besides. The Nasdaq crowd did the opposite again, adding longs and covering close to 13,000 shorts to sit net long better than 52,000. One crowd leaning against the tape and the other leaning with it, on two indexes that closed the week in the same place.
Vol: VIX went out at 14.87, the same number it printed the Friday before, with the 10-year at a nineteen year high and payrolls five sessions out. Nothing in that number says anybody’s worried about Friday.
The Calendar
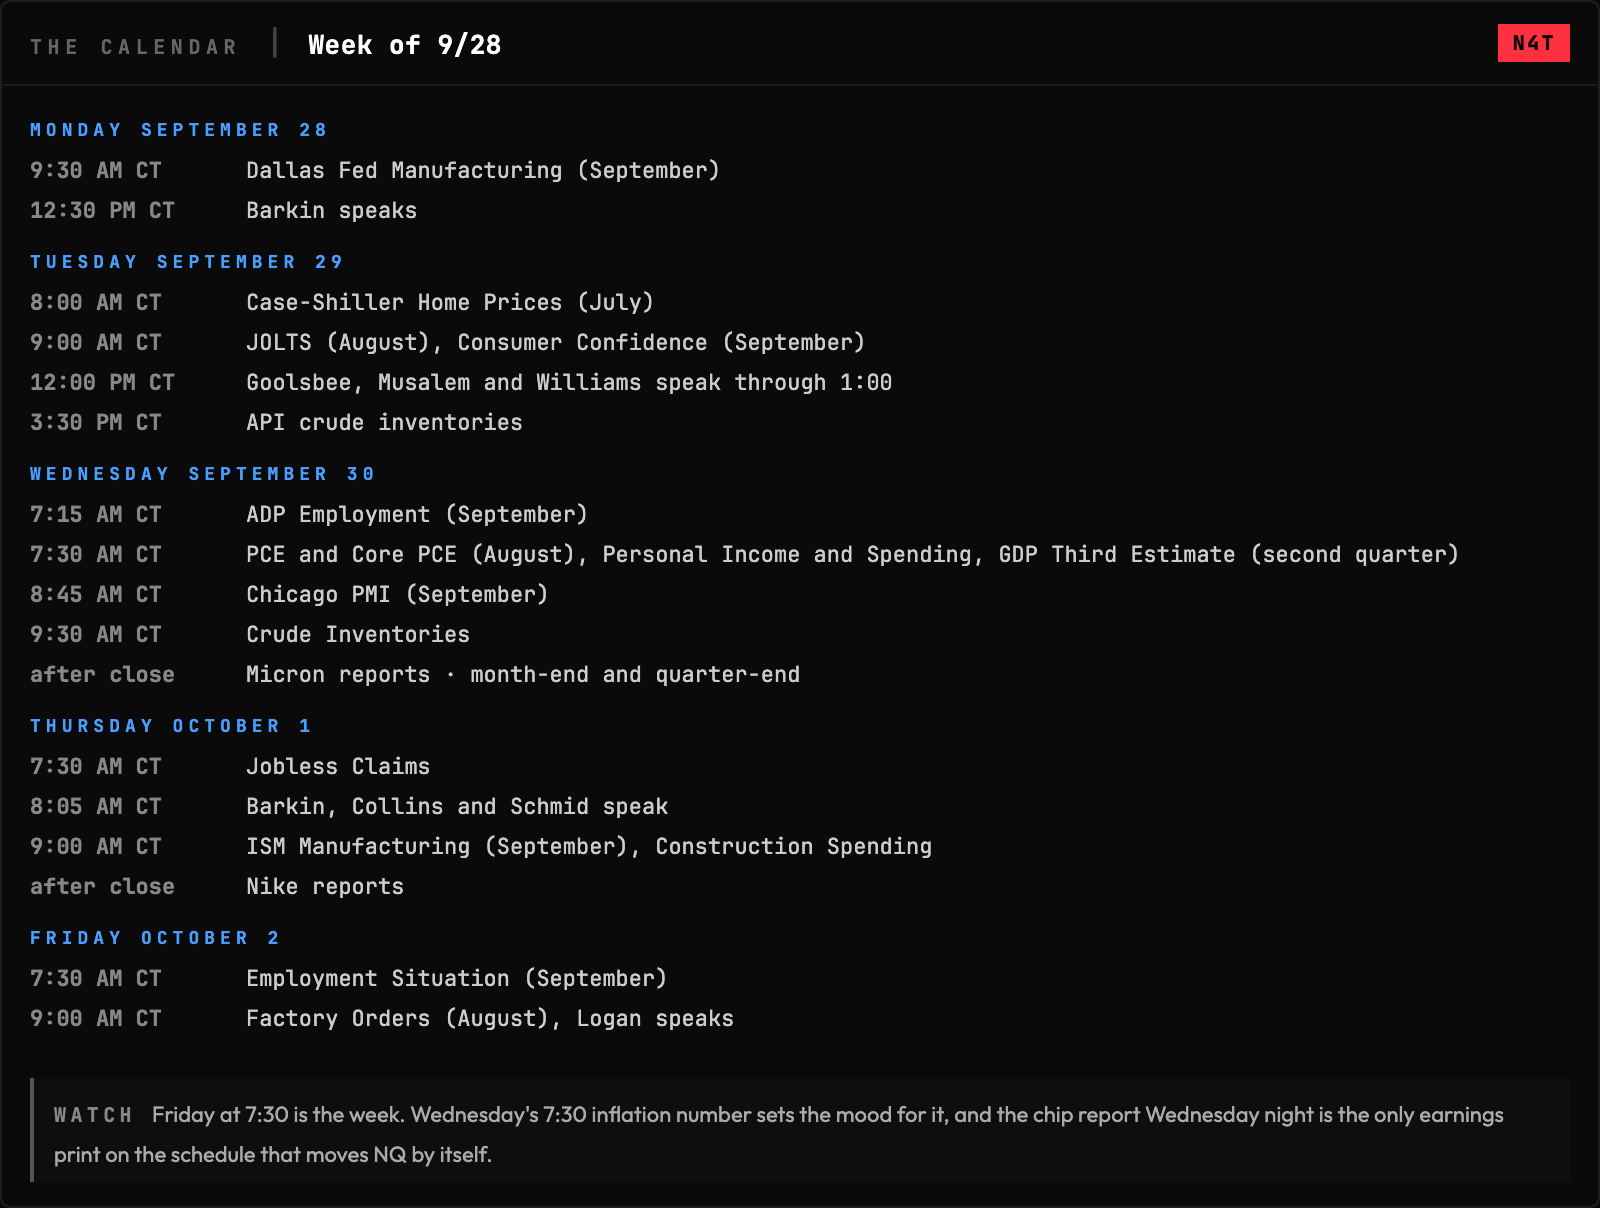
Eleven speaking slots in five days and two prints that matter. Everything between them is noise with a time stamp.
What I’m Watching This Week
1. Friday at 7:30. The September jobs number lands with October hike odds sitting at seventy percent, and every read below this line is conditional until it prints. Wednesday’s 7:30 inflation number gets to set the mood two days early.
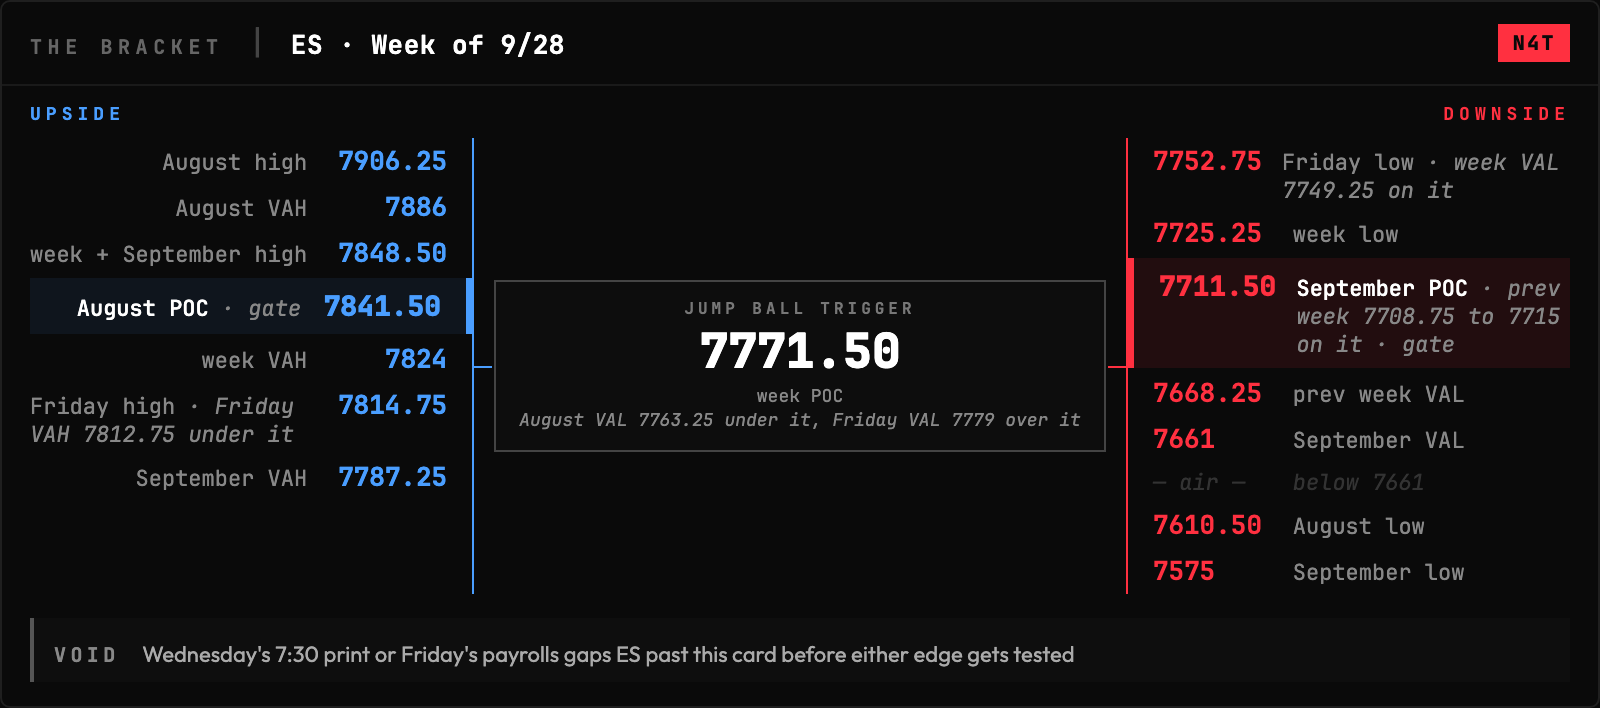
2. ES 7711.50. September’s POC, with last week’s 7708.75 POC and its 7715 ceiling stacked on it, and Thursday’s 7707.25 overnight low printed right underneath the pile. Everything above that shelf is a market that bought the dip. Under it, Wednesday and Thursday were the start of something.
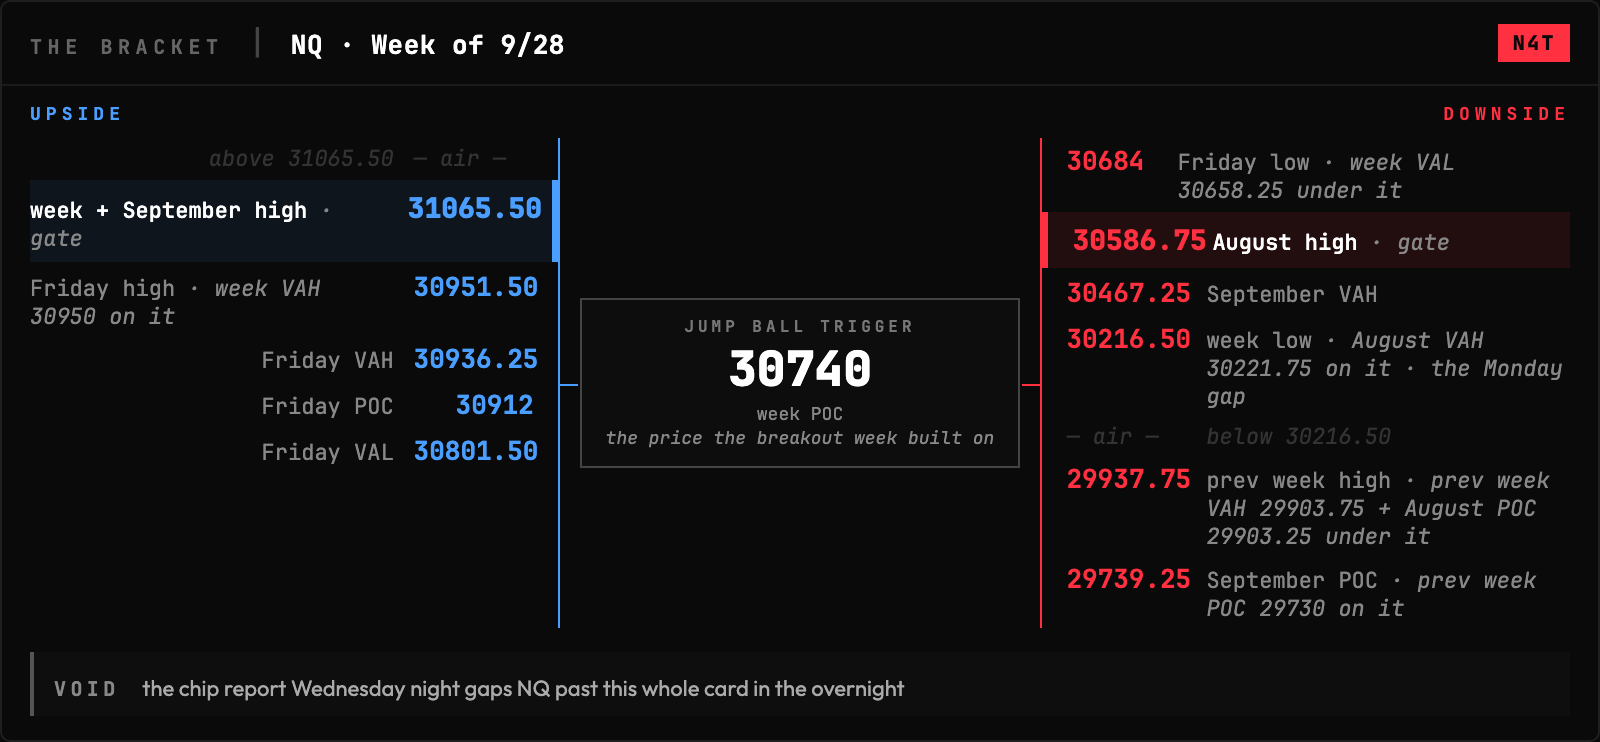
3. NQ’s Monday gap. 30216.50 is the week low, August’s 30221.75 value ceiling sits on it, and nothing has traded there since Monday’s open. As long as that gap stays open the breakout week stands. Fill it and NQ is back inside August with a lot of people offside.
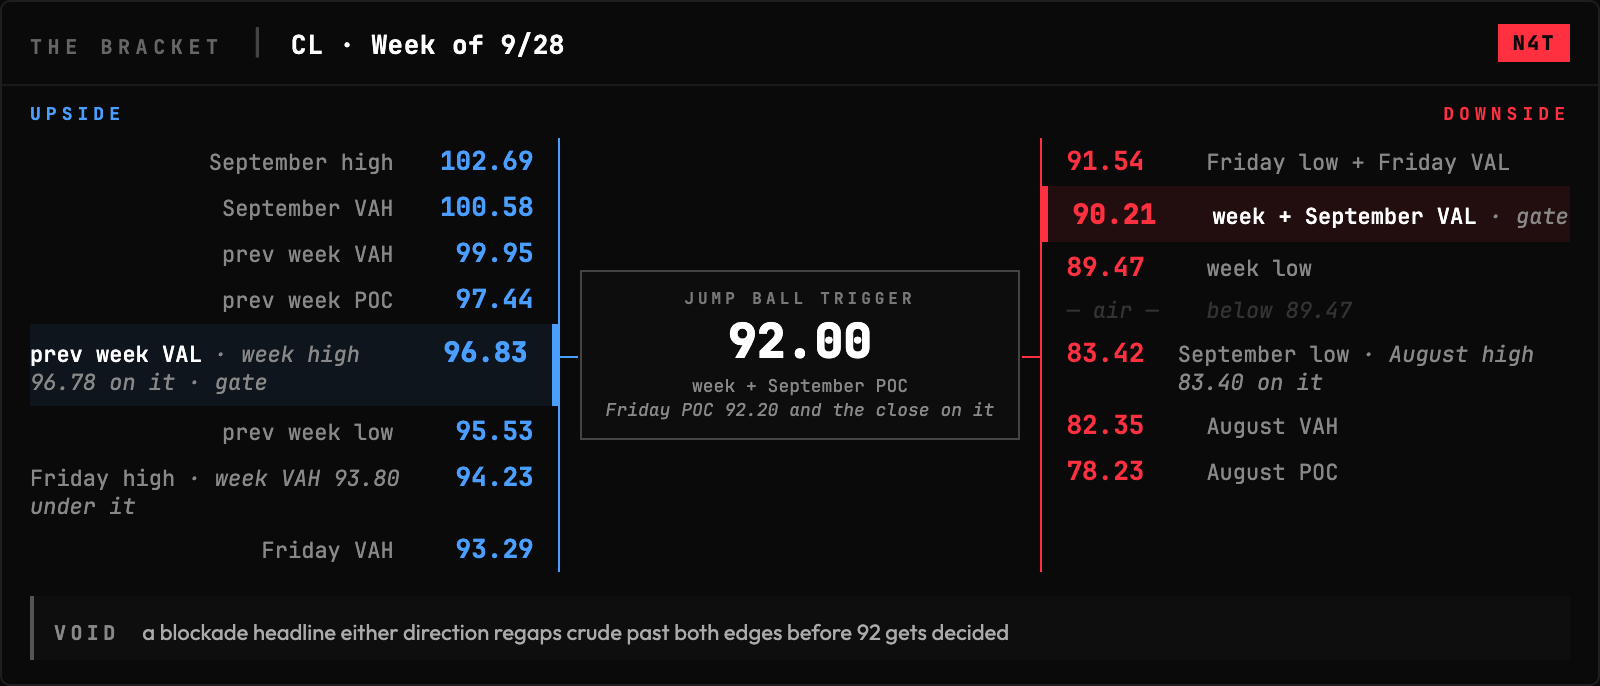
4. Crude on 92. The week, the month and Friday all left their POC on the same number. Whichever edge of Friday’s range goes first, 93.29 or 91.54, gets the next leg, and 96.83 is where last week’s value begins while 90.21 is where September’s ends.
5. Wednesday’s quarter turn. Month-end and quarter-end land on the same session as the inflation number, with the memory chip report after that close. Thursday prints new monthly opens on all four charts and everything I call September in this brief becomes last month overnight.
The Week’s Plan
ES:
ES is 7804.50, standing on Friday’s 7803.50 POC with 7771.50, the week’s POC, and August’s 7763.25 value floor stacked underneath, and that stack is the trigger. What the week proved is that the 7708.75 to 7715 shelf, where September and last week both left their POC, has real buyers on it, because Thursday’s overnight went to 7707.25 and turned around inside one session. What it hasn’t proved is that it can hold above 7824, the ceiling its own value built, since Tuesday’s 7848.50 got sold for two straight days. Hold 7771.50 and the first work is 7814.75, Friday’s high, with the week’s 7824 ceiling right over it. Through 7824 the target is 7841.50, August’s POC, where the summer put its actual volume, and 7848.50, the double top the week and the month share. Past that pair there’s nothing on the map until 7886, where August topped its value, and 7906.25 its high. Lose 7771.50 and the first catch is 7752.75, Friday’s low sitting on the week’s 7749.25 floor. Under that it’s 7725.25 the week low and then the 7711.50 shelf, the gate for the whole read. Give up 7708.75 and the next real volume is 7668.25, last week’s value floor, and 7661, September’s.
NQ:
NQ is 30891.50 and the line is 30740, the week’s POC, because the whole breakout lives above it and price hasn’t closed under it since Monday’s gap. Above price the map is short: 30912 Friday’s POC, 30950 where the week and Friday both capped their value, and 31065.50, the high the week and the month share. Clear 31065.50 and there’s nothing, it’s price discovery, and I’ll be watching the overnight singles it leaves behind rather than guessing a number. The argument against chasing it is where the week actually did its business, because 30740 sits well under the close and Thursday’s overnight already went to 30370 once. Lose 30740 and 30684, Friday’s low on the week’s 30658.25 floor, catches first. Then 30586.75, the high August made, is the gate, because under it this week’s breakout is back inside the old month. Below the gate it’s 30467.25, September’s value ceiling, and then the 30216.50 week low with August’s 30221.75 ceiling printed on it, the Monday gap that never filled. Fill the gap and the map is empty until the 29903 shelf, where last week’s ceiling and August’s POC print together, and 29739.25, September’s POC.
CL:
Crude is 92.24 sitting on 92.00, and that number is the whole plan, because the week’s POC, September’s POC and Friday’s 92.20 POC all landed on it. It went 93.70 to 89.47 to 96.78 and back in four sessions, so the profile is a fat middle with two failed excursions, and nobody who bought the Thursday rip or sold the Tuesday flush is happy tonight. That’s a rotation week, and 92 is where the market agrees until one edge of Friday’s range goes. Take 93.29, Friday’s ceiling, and 93.80 the week’s is right behind it, then 94.23 Friday’s high. Through 94.23 the work is 95.53, last week’s low, then 96.83 where last week’s value began with the 96.78 week high sitting on it. That pair is the gate back into a market that traded 100 two weeks ago. Past the gate it reads 97.44, last week’s POC, then 99.95 its ceiling and 100.58 where September’s value tops. Lose 91.54, Friday’s low and value floor on one print, and 90.21 catches, the floor the week and September share. Under 90.21 it’s 89.47 the week low and then nothing, the profile is empty down to 83.42, September’s low, with August’s 83.40 high sitting right on it.
GC:
Gold is 4321.30 on the week’s 4320 POC, under September’s 4341.90 value floor, and 4320 is the trigger because it’s the only price this week where buyers and sellers agreed on anything. It sold from 4405.60 Monday morning to 4279.50 Thursday, a new low for the month under last week’s 4293, and Friday’s bounce got it back to the POC and stopped. Four straight sessions of business under the month’s value with the dollar at a two month high is a chart that has to prove something before I’m interested from the long side. Hold 4320 and the first job is 4341.90, September’s value floor, with Friday’s 4345.30 high printed over it. That’s the reclaim that puts gold back inside its month. Over it the work is 4367.60 the week’s ceiling and 4380.70 where August’s value began, then 4397.90 last week’s ceiling. Through those the 4408 September POC with the 4407.80 week high printed on it is the gate. Above the gate 4427.60 last week’s high and 4442.70 August’s POC are the only volume left overhead. Lose 4320 and 4306.50, Friday’s value floor, catches, then 4293, where last week’s low and value floor print together with Friday’s 4289.20 low under them. Give up 4279.50 and there’s nothing, no volume on this contract until 4079.20, the low August made.
The White Van Stuff
The weight in the index books is parked in the same corner it was last week, with the semiconductor book at the 98th percentile of its own year, the Nasdaq-100 ETF at the 91st and Microsoft and Meta in the 90s, while small caps sit at the 9th, the banks at the 16th and the long bond at the 16th. The S&P book swung from the 94th percentile Monday to the 58th Wednesday and back to the 81st Friday, which is a book chasing the tape instead of leaning on it. Into Friday’s expiration both index books carry better than two puts for every call, crude’s nearest book carries closer to four, and gold’s is the only one running even.
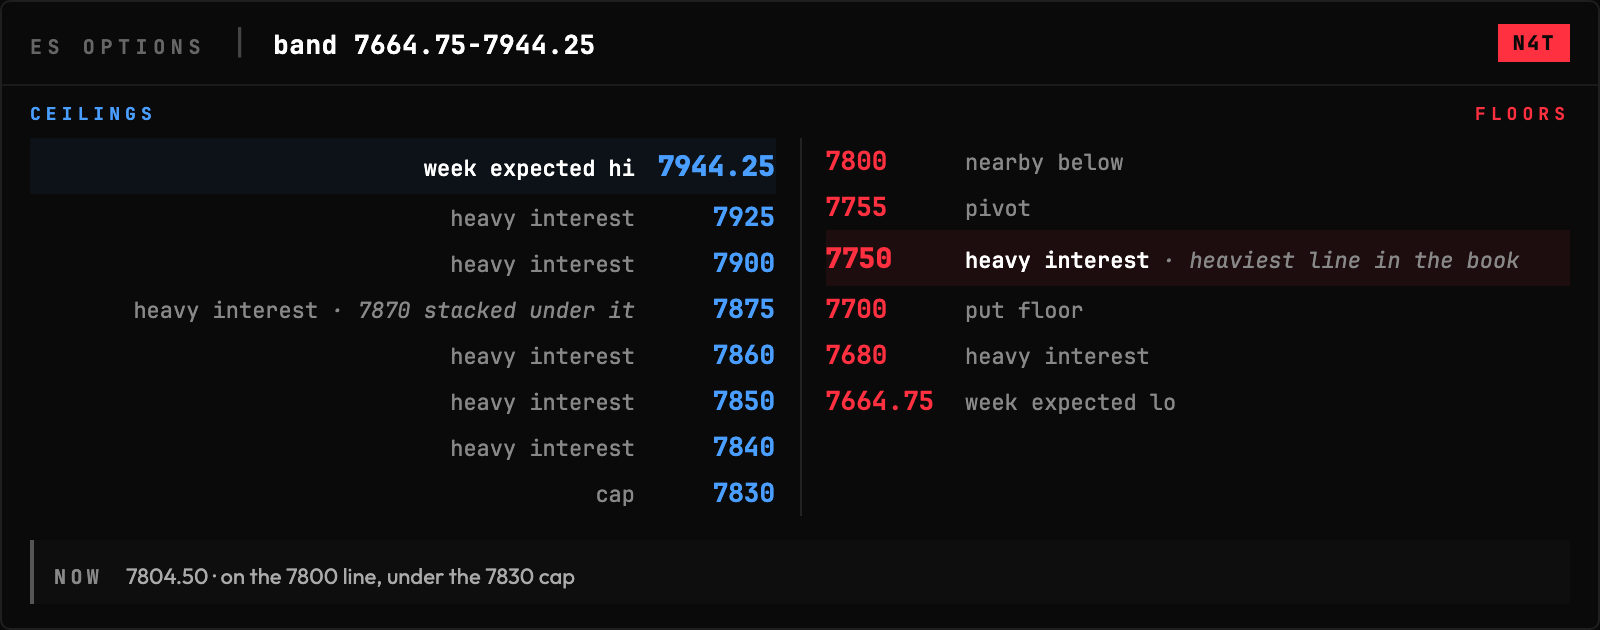
ES: The cap on this book is 7830, sitting right over the 7824 ceiling the week’s value built, so the options crowd and the profile drew the same line. Underneath, the heaviest interest in the book is 7750 with the 7755 pivot stacked on it, and the 7700 put floor lands on the same shelf the profile calls the gate. Price closed on the 7800 line, between the two, with the week band running 7664.75 to 7944.25.
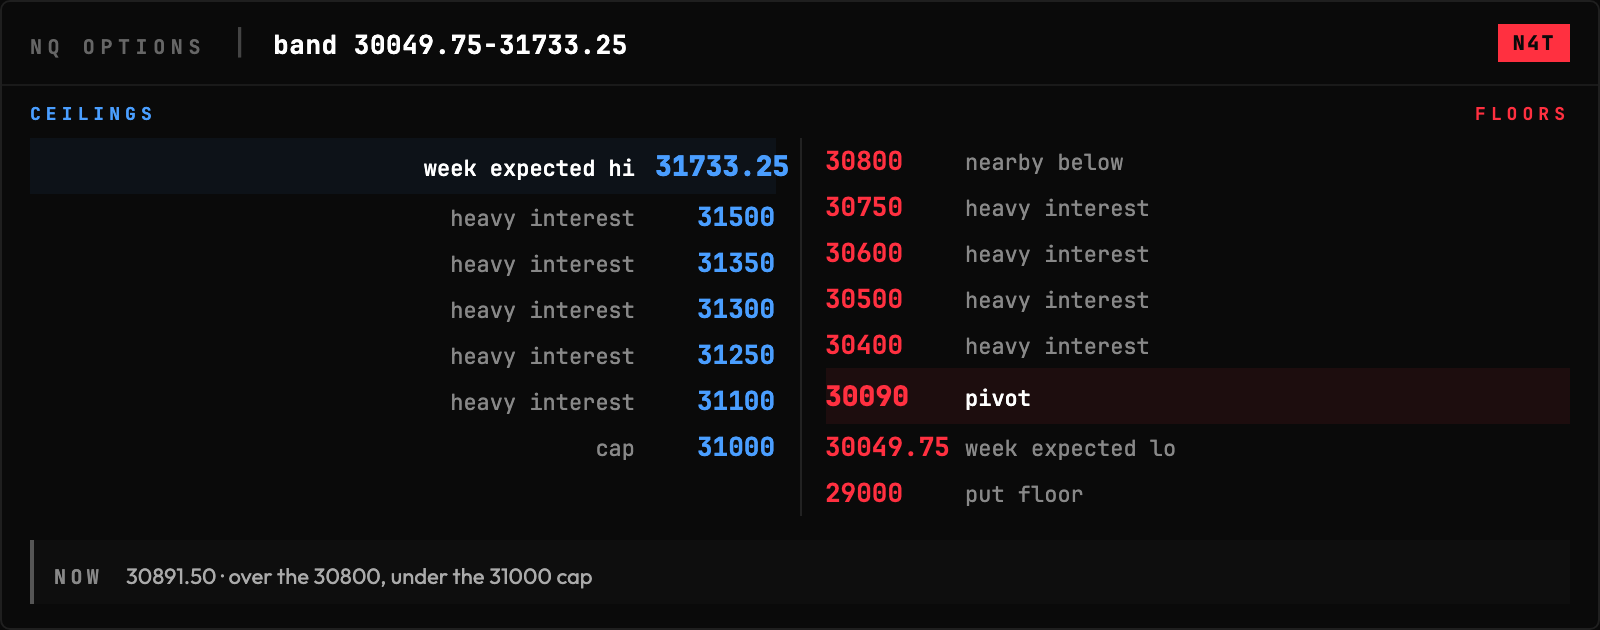
NQ: The tech book has 31000 as its cap with 31100 and 31250 stacked right behind it, all of it inside the week band, and nothing under price with real weight until 30800 and 30750. The pivot in this book is all the way down at 30090 with 29000 the first floor under it, which tells you the options crowd built this cage before the Monday gap and hasn’t caught up. Price is 30891.50, over the 30800 and under the cap.
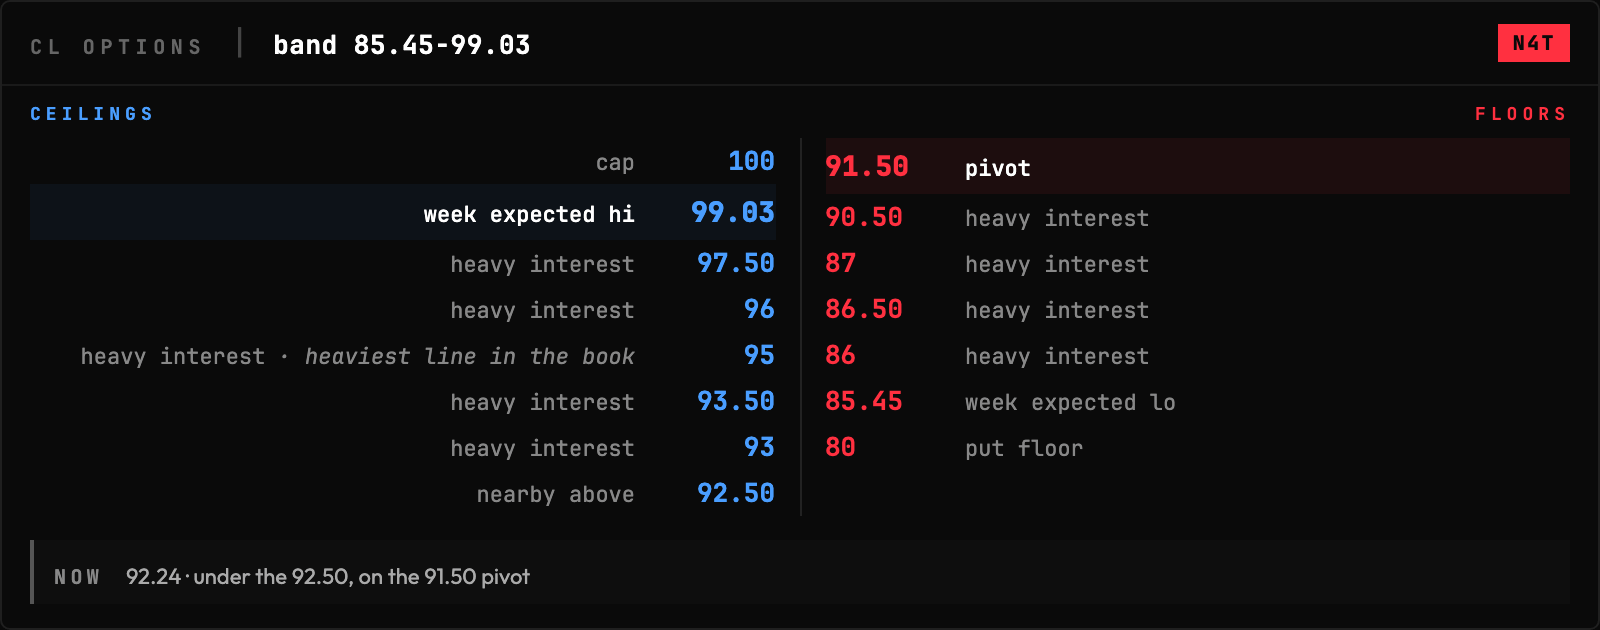
CL: Crude’s book has 95 as its heaviest line and it sits right over price, with the 100 cap the only thing above it that matters. Under price the 91.50 pivot is the first line, then 90.50, then a hole to the 87 and 86 cluster with 80 the last thing the book owns. Price is 92.24, under 92.50 and sitting on the pivot, with the nearest expiration carrying close to four puts for every call.
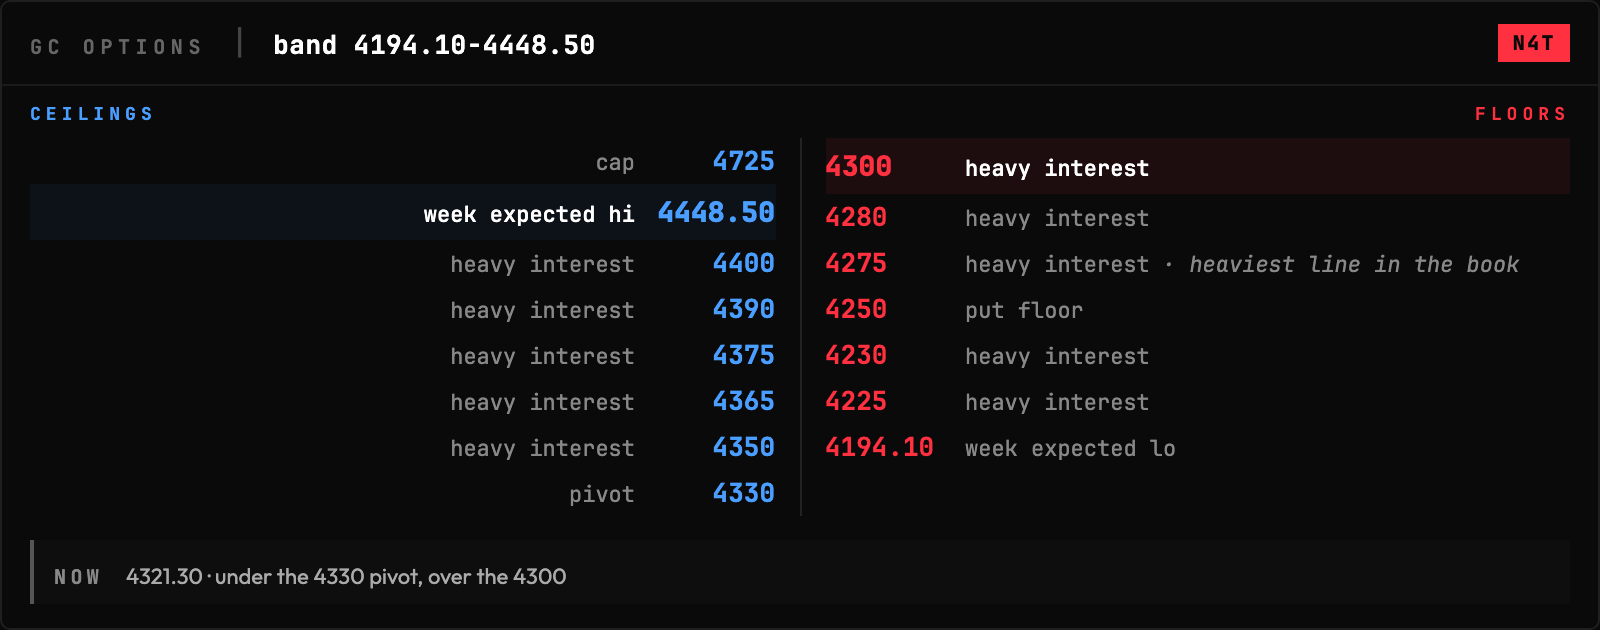
GC: Gold’s book is the only one on the board with its heaviest interest under price: 4275 and 4300 are the two biggest lines and both sit below Friday’s close, with the 4250 put floor right under them. Overhead the pivot is 4330 and then a ladder from 4350 through 4400 into a 4725 cap that hasn’t mattered since August. Price is 4321.30, under the pivot and over the 4300.

If this brief is making you money, the best way to back me is to trade with Lucid Trading. Use my link or code VIBE.
I am not a financial advisor, CTA, or portfolio manager. Nothing here is a recommendation to buy, sell, or hold anything. Futures trading is not suitable for everyone. You can lose more than your initial investment. Only trade with money you can afford to lose. Past performance does not guarantee future results.
Free orderflow course: course.nick4atick.com | X: @Nick4ATick